
Hacking is a practice that is as old as computers. The term “hacker” dates back to the 1960s. Experts at MIT coined the term to refer to highly talented and skilled programmers who practiced hardcore programming in old languages. Over the years, this term developed a poor reputation.
Today, “hacker” is exclusively used in a negative sense, referring to individuals who commit cybercrimes. Hackers, otherwise known as cybercriminals, find new and creative ways to exploit bugs and poor software or hardware design to steal, corrupt, or encrypt data and wreak chaos in computer systems and networks.
With the number of cyberattacks increasing every day, it’s hard to keep track of the statistics, facts, and understand which cyber threats await us in the future. This is why we have conducted the in-depth research contained in this article. If you wish to fully grasp the world of cyber attacks by using verified numbers, you’ve come to the right place.
Top 10 Hacking (Cyber Attack) Statistics
- 30,000 websites are hacked every day worldwide.
- 71% of all online breaches are financially motivated.
- Estimated ransomware costs for H1 2021 were $416 million.
- In 2021, corporate ransomware attacks occurred every 11 seconds.
- Тhe biggest cyber attack occurred in 2013 when hackers breached over 3 billion Yahoo accounts.
- Over 500,000 Zoom account credentials ended up for sale on the dark web on April 14, 2020.
- It’s estimated that COVID-19 increased data breach costs in the US by $137,000 due to promoting work from home.
- Fake news and disinformation campaigns will continue to spread chaos in 2022.
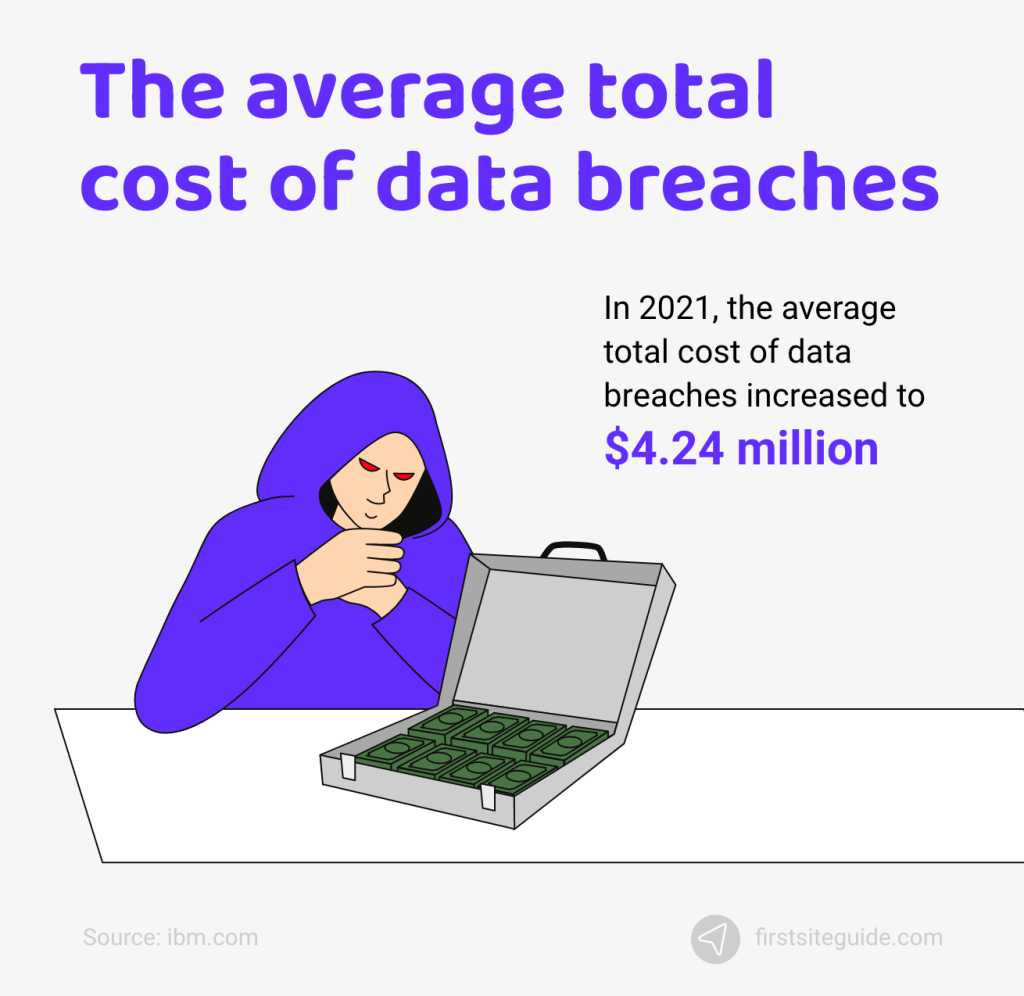
- Data breaches during 2021 generated on average $4.24 million in costs.
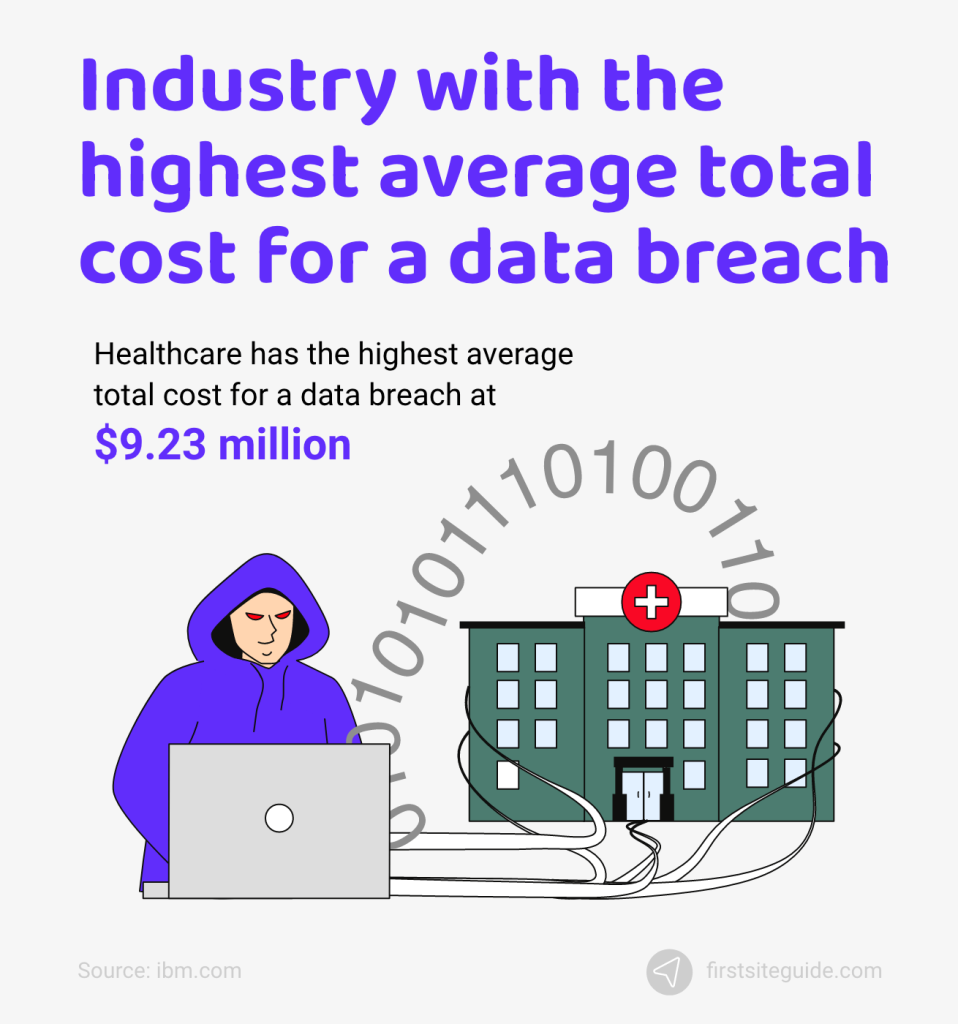
- Healthcare has the highest average total cost for a data breach at $9.23 million.
- Organizations with high security AI and automation levels experienced the most significant data breach-related cost savings.
General cyber-attack stats: what’s most often hacked and how frequently?
Cyber attacks are not entirely random. After examining the numbers more closely, you can spot some patterns emerging. Simply put, it appears that hackers prefer some data types more than others. It’s pretty interesting to dive deeper into these numbers.
What types of data are most often compromised? What motivates the hackers to commit crimes? What type of malware is most commonly used? Scroll down to find answers to these questions.
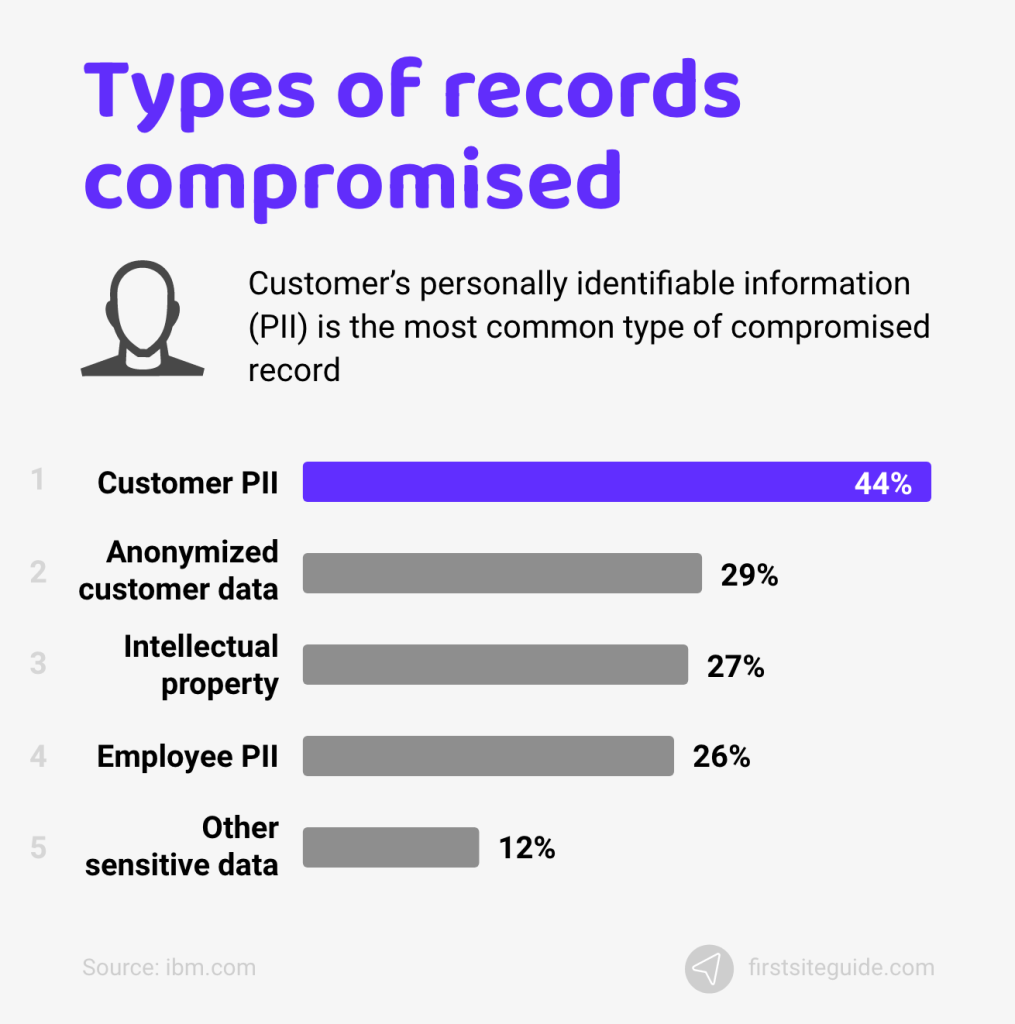
1. At 44% of all attacks, customer personally identifiable information (PII) is the most common type of record compromised.
A hacker can target various types of records online, including customer PII, anonymized customer data, intellectual property, employee PII, and other sensitive data. However, hackers most often target customer PII. Customer PII amounts to 44% of the overall types of records compromised.
The second most common type of record compromised in cyber attacks is anonymized customer data at 28%. This data is modified so that PII is removed. Intellectual property is the third most common type of compromised record at 27%.
(Source: ibm.com)
2. 30,000 websites are hacked every day worldwide.
If we examine the global stats for cybercrime, we can conclude that about 30,000 websites are hacked every day worldwide. That works out to roughly 4,000 cybercrime attacks daily in the United States.
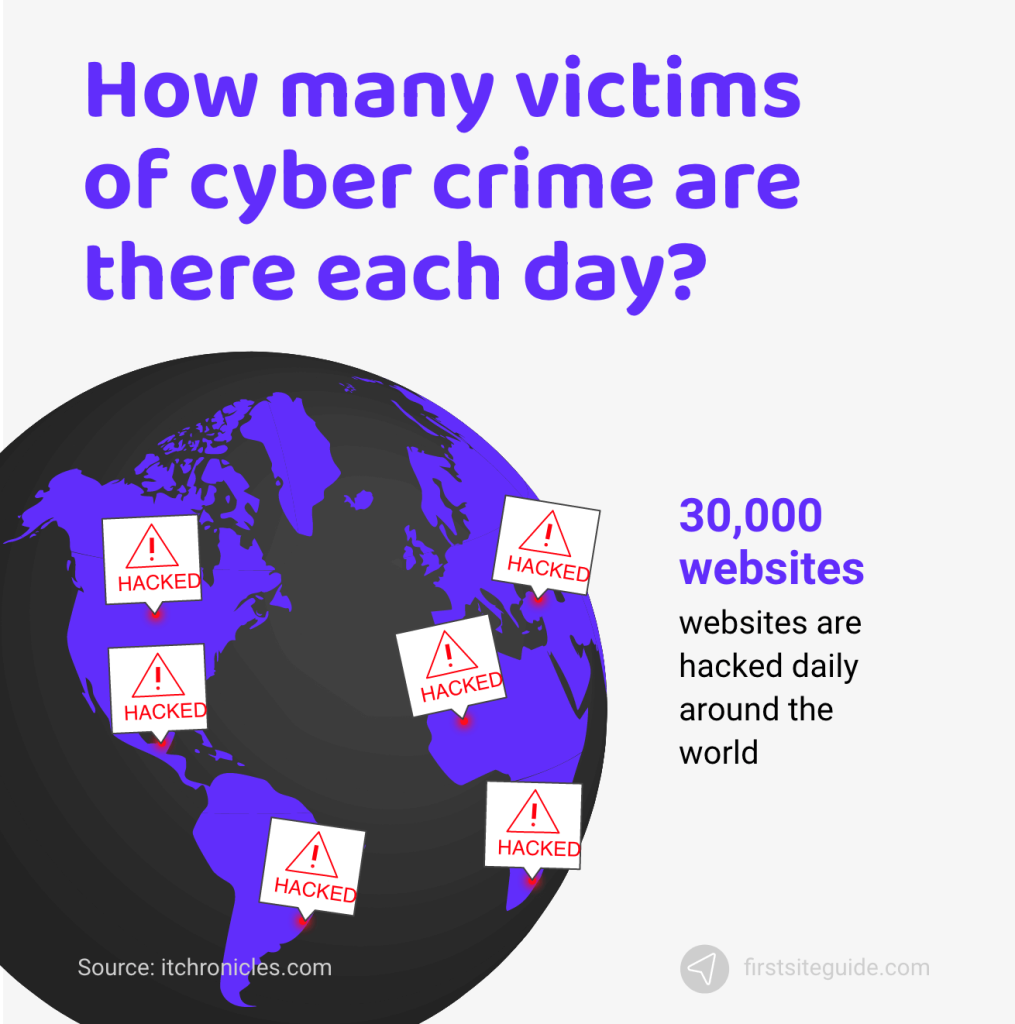
(Source: itchronicles.com)
3. 93% of company networks are hacked by cybercriminals.
Modern-day hackers can easily breach 93% of corporate networks. In such cases, a cybercriminal acts as an external attacker, using advanced software hacking tools to breach a company’s network safety and security measures and access data and local network resources.
(Source: betanews.com)
4. Тhe biggest cyber attack occurred in 2013 when hackers breached over 3 billion Yahoo accounts and stole the holders’ credentials.
From countless cyber-attacks that have happened over the years, the largest hack in history took place in 2013 when hackers managed to breach Yahoo security measures and steal the credentials from over 3 billion account users.
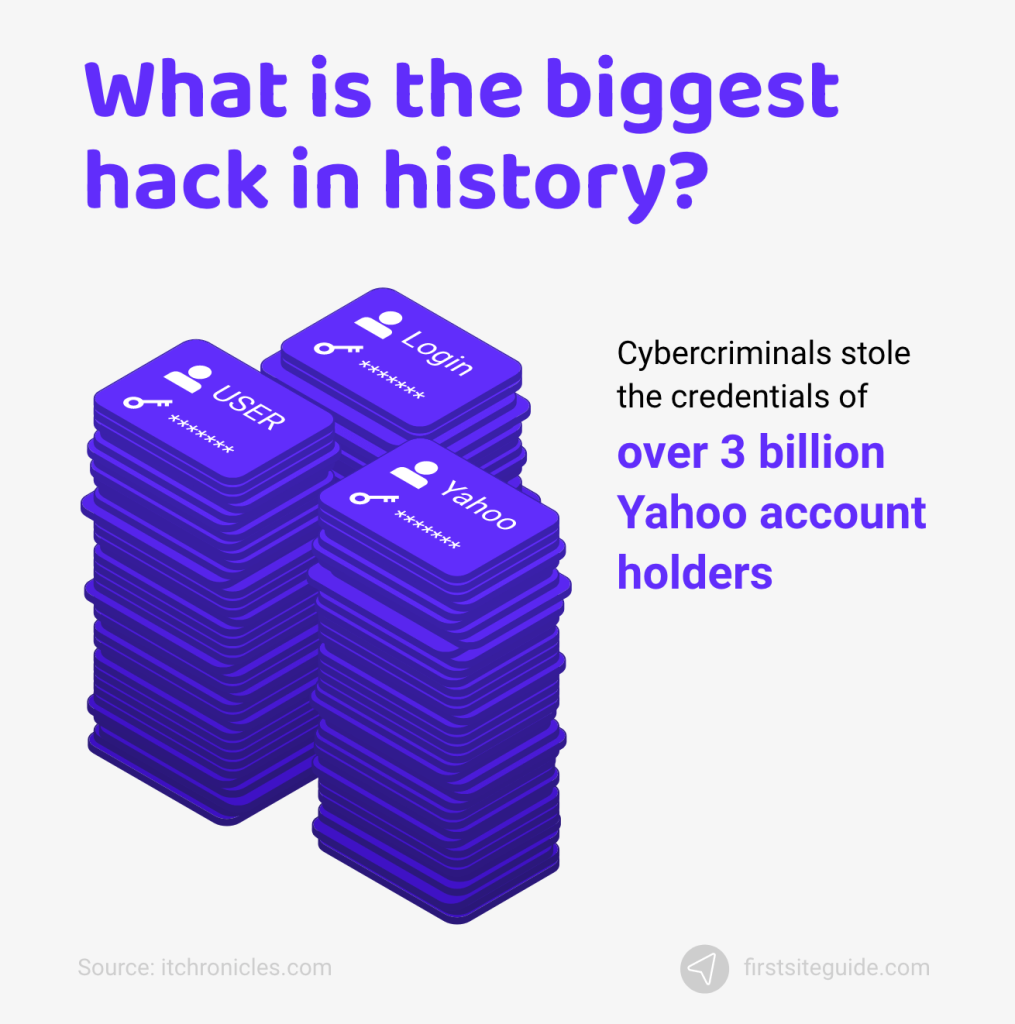
(Source: itchronicles.com)
5. In 2020, there were more than 10 million DDoS attacks.
DDoS attacks stand for distributed denial-of-service attacks and are a common cyber threat. The coronavirus outbreak made DDoS attacks one of the biggest trends among hackers. The result was even more terrifying – over 10 million attacks occurred in 2020 alone. That’s 1.6 million more attacks than in 2019.
(Source: enisa.europa.eu)
6. Which industries are affected the most by cyber threats such as ransomware?
According to the most recent cybersecurity statistics, the industries most targeted by ransomware are retail, government, financial, and healthcare industries. Statistics further indicate that more than 70% of cyber breaches are financially motivated.
(Source: itchronicles.com)
7. In 2021, cyberattacks on business organizations increased by 50%.
2021 was the year of increased hack attacks on business organizations when compared to the previous year. Weekly corporate hack attacks increased by 50%.
The industries most affected on a global scale in 2021 were:
- Research/education sector (up by 75%)
- Healthcare industry (up by 71%)
- MSP/ISP (up by 67%)
- Communications sector (up by 51%)
- Military/government sector (up by 47%)
(Source: cybersecurityintelligence.com)
8. More than 90,000 internet users fall victim to various cyber threats every month in the U.S.
According to the most recent stats on cybercrime, over 90,000 people are affected by hack attacks every month in the United States.
(Source: itchronicles.com)
9. Global spending on the latest cybersecurity measures and solutions is expected to reach $133 billion by the end of 2022.
The COVID-19 pandemic made countless businesses more focused on cybersecurity measures than ever before. The latest studies indicate that global corporate spending on the most advanced cybersecurity protection is expected to reach around $133 billion by the end of 2022.
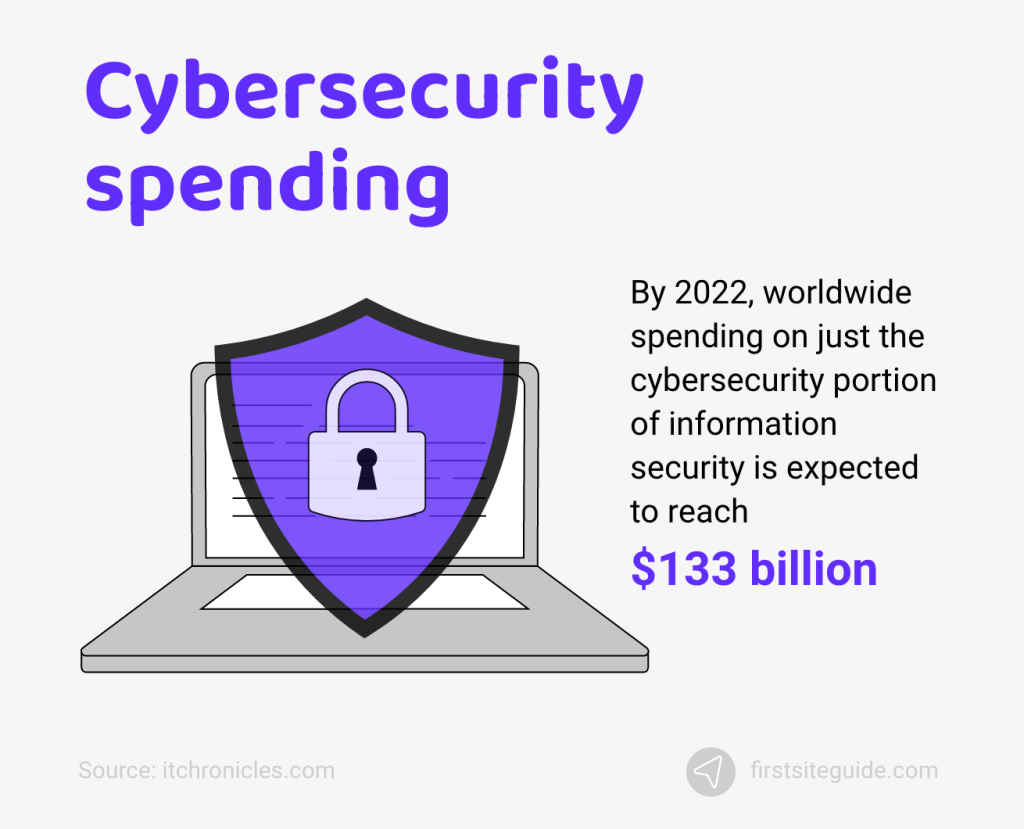
(Source: itchronicles.com)
10. In 2021, corporate ransomware attacks occurred every 11 seconds.
In the last year, businesses were exposed to ransomware attacks every 11 seconds. According to Cybersecurity Ventures, there are estimates that ransomware attacks on businesses and regular internet users will increase by 2031 and occur every two seconds.
(Source: cybersecurityventures.com)
11. Social engineering/phishing attacks are the most common type of cyber threat for small businesses (57%).
According to the latest studies, stats indicate that the most common types of hack attacks on small business organizations include:
- Social engineering and phishing (57%)
- Stolen and compromised devices (33%)
- Credential theft (30%)
(Source: keepersecurity.com)
12. A recent survey showed that 70% of healthcare organizations had experienced some form of ransomware attack.
According to a recent survey, around 70% of healthcare organizations have already dealt with ransomware attacks. These attacks caused all sorts of trouble for these organizations, ranging from an increase in patient mortality due to poor test outcomes to delays in procedures and longer lengths of stays in hospitals and medical care institutions.
(Source: censinet.com)
13. Every month, hackers use form-jacking code to compromise an average of 4,800 websites.
From all of the types of cyber attacks, form-jacking attacks appear to be most frequent. The cyber security leader Symantec deems them popular because they are simple and lucrative. These attacks enable hackers to steal online shoppers’ credit card details.
Over 4,800 websites are compromised every month by hackers injecting form-jacking code, making it the most common type of cyber attack.
(Source: symantec.com)
14. 34% of all data breaches in 2018 involved internal actors.
The human factor remains one of the top challenges for companies that want to improve their cybersecurity practices. Cybercriminals are often not able to execute their malicious plans without an accomplice.
Data breaches appear to be the most challenging, compelling hackers to work with someone inside the company. Out of all data breaches in 2018, 34% involved internal actors.
(Source: verizon.com)
15. 71% of all breaches are financially motivated.
Various factors motivate cybercriminals to breach targets’ defenses and steal or corrupt data. It appears that money is the leading driver. The majority of breaches, 71% to be exact, are financially motivated.
Interestingly enough, 25% of all breaches are motivated by espionage. It seems that some companies hire hackers to locate data that would give them a strategic advantage.
(Source: verizon.com)
16. Out of all incidents caused by malware, ransomware was used in nearly 24%.
Cybercriminals utilize various tactics to launch attacks, ranging from hacking and social attacks to malware and exploiting misuse by authorized users. Malware continues to be the main culprit behind security incidents and breaches.
Ransomware, a type of malware, is among the most significant issues for organizations. It is used in nearly 24% of incidents, making it more common than a backdoor, spyware/keylogger, adware, and adminware-based attacks.
(Source: verizon.com)
The most recent data breach stats and facts
Thousands of cyber attacks take place around the globe as you read this. Some are niche targeted and too small to be picked up by news portals. However, others cause devastating consequences.
What are the most recent noteworthy data breaches? How many attacks were there in 2020 and 2021? Do the reports indicate a downtick or uptick of cybercriminal activity? Let’s find out.
17. Over 600 ransomware-related SARs were filed by financial institutions in the first half of 2021.
A Suspicious Activity Report is a standard form used to report suspicious activity. Financial institutions employ it to report various activities, including cyber attacks. The best way to assess whether hackers target these institutions is to see how many SARs were filed.
During the first half of 2021, institutions in the financial sector filed 635 SARs, all of which were related to suspected ransomware-based cyber attacks.
(Source: forbes.com)
18. Estimated ransomware costs for H1 2021 were $416 million.
Ransomware-related cyber attack impact is best measured through the financial damage inflicted on institutions. The latest reports indicate that estimated ransomware costs for H1 2021 were $416 million.
This tells us that there were more ransomware attacks in 2021 than in 2020 and that they inflicted more financial damage than the attacks of the previous year.
(Source: forbes.com)
19. As for reported ransomware transactions, the average amount per month in 2021 was $102.3 million.
The other side of ransomware-related cyber attacks are ransomware transactions. This reflects the money that companies need to pay to hackers to have their data returned. Keep in mind that the following findings only reflect reported ransomware transactions. A lot of these transactions go unreported.
The average amount of reported ransomware transactions per month in 2021 spiked above $100 million. Every month, companies paid an average of $102.3 million to hackers to get their data back.
(Source: forbes.com)
20. During Q4 of 2021, the number of application-layer DDoS attacks that targeted the manufacturing industry spiked by a whopping 641%.
Application-layer DDoS attacks are designed to exploit vulnerabilities and render an app unable to deliver content to a user. During Q4 of 2021, a record-high number of these attacks were recorded, especially targeting the manufacturing industry. The number of application-layer DDoS attacks during this period spiked by a whopping 641%.
(Source: portswigger.net)
21. The second and third most targeted industries by application-layer DDoS attacks are the business services and gaming/gambling industries.
The manufacturing industry is not the only one targeted by application-layer DDoS attacks. The business services and gaming/gambling industries were the second and third most targeted industries by the same type of DDoS attack.
(Source: portswigger.net)
22. The big game developer company, Ubisoft, confirmed that Just Dance video game data was breached in December 2021 but no accounts had been improperly accessed.
After the public announcement, it became clear that Ubisoft fell victim to cyber attacks carried out by unknown actors. The attackers exploited the company’s misconfiguration vulnerability to access data.
The game developer said that no accounts had been improperly accessed. The breach was limited to technical identifiers such as device IDs, profile IDs, GamerTags, and uploaded videos to be shared with the in-game community.
(Source: portswigger.net)
23. Over 500,000 Zoom account credentials ended up for sale on the dark web on April 14, 2020.
The Zoom online conferencing platform became immensely popular during the COVID-19 pandemic, making it a primary target of many cyber attacks. While there were no indications of a breach, the eventual outcome made it clear that such an attack had occurred.
In fact, over 500,000 Zoom account credentials were listed on sale on the dark web on April 14, 2020. This data included users’ emails, passwords, personal meeting URLs, and Zoom Hosk Keys. Most of the account details sold for a penny each, while some were free.
(Source: fightingidentitycrimes.com)
24. Personal information belonging to over 10.6 million hotel guests who stayed at MGM Resorts ended up being posted on a hacking forum on February 20, 2020.
Even the biggest hotel chains are not 100% safe from cyber attacks. One of this niche’s most significant data breaches was on February 20, 2020. Hackers targeted MGM Resorts and managed to steal the personal information of over 10.6 million hotel guests. They published the data on a hacking forum.
The hotel’s personal information database also contained files containing personal and contact details of tech CEOs, celebrities, reporters, and government officials. These files also ended up on a hacking forum.
(Source: zdnet.com)
25. On July 20, 2020, hackers managed to get through to an unsecured server of a company offering family history search software.
This event is a perfect example of why no one should leave a server unprotected. On July 20, 2020, hackers found an open and encrypted server that belonged to the company behind a popular family history search software.
They breached the server and leaked sensitive data belonging to over 60,000 customers. This data included not only email addresses but also user locations.
(Source: wizcase.com)
26. The California Department of Motor Vehicles fell victim to a data breach on February 18, 2021.
This cyber attack on the California Department of Motor Vehicles is proof that even government institutions functioning behind state-of-the-art firewalls are not safe from cybercriminals. California DMV issued an official statement on February 18, 2021, to alert drivers that they had suffered an attack resulting in a data breach.
The DMV billed using the Seattle-based Automatic Funds Transfer Services and was hit by a ransomware attack. The breach happened through this contractor and compromised “the last 20 months of California vehicle registration records.”
(Source: techcrunch.com)
27. It’s estimated that COVID-19 increased data breach costs in the US by $137,000 due to promoting work from home.
One of the most commonly seen COVID-19 measures taken worldwide was remote work. Companies across all industries enabled workers to work remotely. However, this remote work caused a spike in data breaches. Just in the US, the cost of data breaches increased by $137,000, and it’s all related to increased levels of remote work.
(Source: ibm.com)
28. May 2020 was notorious for cyber attacks. During this month, there were almost 200,000 coronavirus-related cyber attacks per week.
The number of coronavirus-related cyber attacks is not constant. However, the data shows that this number drastically spiked in May 2020. During every week of that month, there were almost an average of 200,000 coronavirus-related cyber attacks.
Compared to the number of attacks in April, that was a 30% increase.
(Source: unisys.com)
Cybercrime predictions for 2022 – what the future holds
Cybercrime is a dynamic field. The types of attacks popularly used in 2021 may or may not remain popular in 2022. The target may also change. Staying tuned to relevant cybercrime predictions for 2022 can help you to update your defenses and minimize the risk of cyber attacks.
Let’s examine the most noteworthy cybercrime predictions for 2022.
29. Fake news and disinformation campaigns will continue to spread chaos in 2022.
In 2022, we will see a better and improved version of fake news – Fake News 2.0. With AI helping to automate fake news, it will become more personalized, optimized, and almost impossible to stop.
2021 was notorious for misinformation and disinformation campaigns regarding the COVID-19 vaccines and the spread of coronavirus. Current predictions are that cyber groups will continue to exploit fake news and campaigns in 2022, as it becomes even easier to launch phishing attacks and scams.
(Source: blog.checkpoint.com)
30. In the eye of the cyber attack storm, we will continue to have cryptocurrencies.
It is logical to see that cryptocurrencies are related to global cyber attacks. Check Point Research (CPR) found the facts to be very interesting, especially the increasing number of incidents involving crypto wallets being stolen. The weakest link – free NFT distributions. CPR decided to take a closer look.
CPR put OpenSea to the test only to discover that leveraging critical security enables you to steal crypto wallets. Trends like this will continue in 2022, and we should see even more cryptocurrency-related attacks.
(Source: blog.checkpoint.com)
31. Deepfake social engineering attacks will become more frequently used in 2022.
Hackers are continuing to weaponize deepfake technology. One of the recent deepfake phishing attacks caught the public’s attention. Hackers targeted a bank manager in UAE. They scammed the manager using a special AI-voice cloning technique. These hackers managed to steal $35 million from the manager.
It appears that deepfake social engineering will become more frequently used in the foreseeable future. Thanks to technological advancements, hackers can use fake audio and video to access private data and manipulate stock prices and opinions. We will see more of these types of attacks in 2022.
(Source: forbes.com)
32. It is expected that the US midterm elections in November 2022 will bring back fake news and misinformation campaigns to social media.
Due to their immense popularity, social media platforms are often used as channels for distributing fake news and launching misinformation campaigns. In 2022, we can expect to see a spike in the number of fake news and misinformation campaigns, especially before and during November, when the US midterm elections are scheduled.
(Source: blog.checkpoint.com)
33. Cyber attacks targeting supply chains will become more common in 2022.
As supply chains become modernized using various technologies, including IoT, they become more frequently targeted by cybercriminals. It is safe to assume that cyber attacks on supply chains will become more common in 2022.
In response to these attacks, governments will establish more regulations to address them and protect the supply chains. Governments will work with the private sector and internationally to identify cyber groups and prevent future large-scale attacks.
(Source: weforum.org)
34. Mobile malware attacks will become more frequent with more people using mobile payment platforms and wallets.
The number of people comfortable using mobile wallets and payment platforms increases month after month. That’s precisely why it is logical to expect to see a proportional increase in mobile malware attacks.
Hackers quickly adapt to new developments. People switching to mobile payment methods will make hackers evolve and adapt to more efficiently exploit the penetration of mobile technologies in payment services.
(Source: checkpoint.com)
35. The newest form of cybercrime will most likely target cloud service providers.
One major trend we can observe across industries is the move to DevOps and cloud. This simply means that microservices architecture will become the dominant method for app development. Cloud Service Providers (CSPs) will continue to embrace microservices at a faster pace.
It is expected that hackers will focus on discovering and exploiting vulnerabilities in microservices, enabling them to launch large-scale attacks. Chances are high that in 2022 we will see more large-scale attacks targeting CSPs.
(Source: weforum.org)
Data breach aftermath – costs by type of attack, region, and more
Cyber attacks that result in data breaches undermine brands, affect customer relationships, and expose customers’ sensitive data. Their implications can also be seen in the sphere of finance. In other words, a cyber attack can have devastating financial consequences for a company.
Below you can find the most “expensive” type of cyber attack, the average cost of a data breach, and other data breach costs-related stats and facts.
36. Data breaches during 2021 generated $4.24 million in costs on average, which is a 10% increase from 2020.
You can assess the scope and impact of data breaches by looking at the average costs. In 2020, data breaches generated expenses averaging $3.86 million. The average cost of a data breach increased in 2021 to a whopping $4.24 million, which is a 10% increase.
(Source: capita.com, ibm.com)
37. The average total cost of data breaches has increased by 11% since 2015.
Looking seven years into the past, all of the way to 2015, makes it clear that data breach costs continue to increase year-over-year. The only exception was 2017 when the average total cost of data breaches was $3.62 million, a 10% decrease from average costs recorded in 2016.
Over seven years, from 2015 to 2021, the average total cost of data breaches increased from $3.79 to $4.24 million, an increase of 11.9%.
(Source: ibm.com)
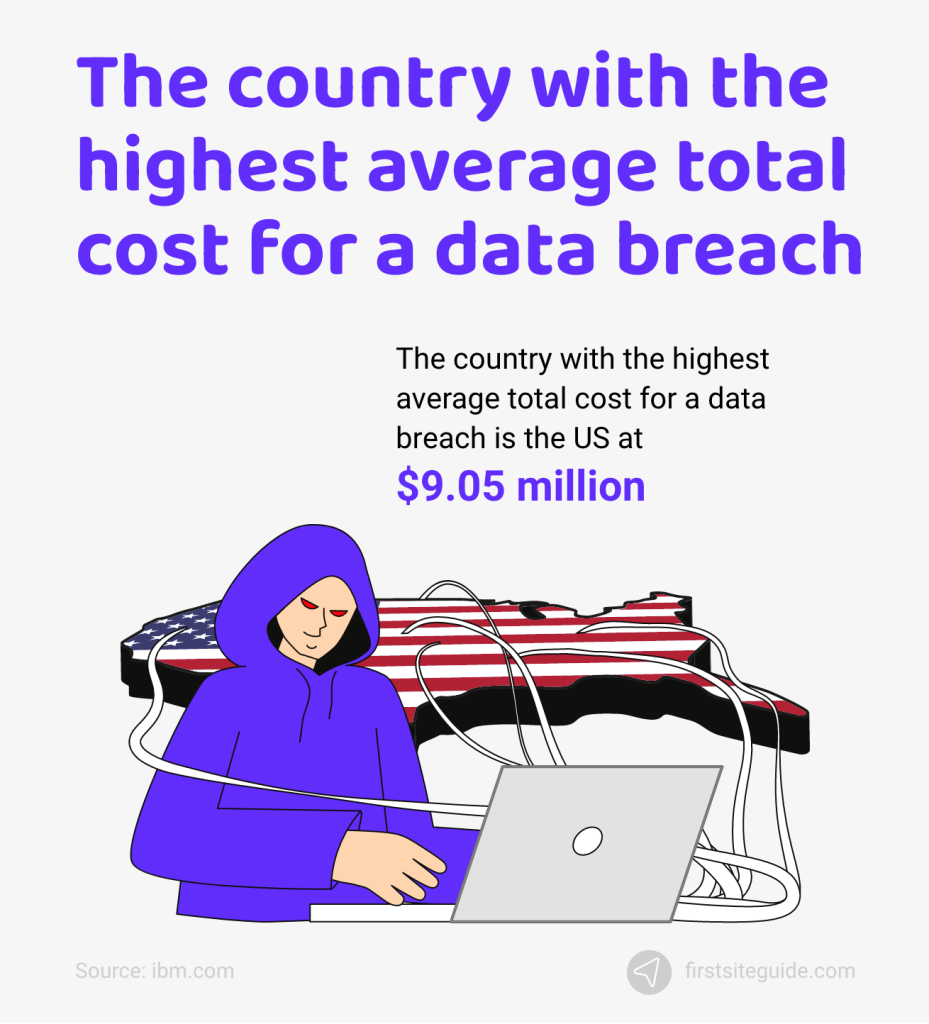
38. The country with the highest average total cost of a data breach is the US at $9.05 million.
The following five countries emerge as those with the highest average total cost of a data breach:
- United States
- Middle East
- Canada
- Germany
- Japan
The US is in the first place, with a total cost of a data breach averaging $9.05 million in 2021. This is a significant increase from the average of $8.64 million recorded in 2020. In the second place, we have the Middle East with an average cost of $6.93 million, increasing from $6.52 million recorded in the previous year. Canada increased from $4.50 million to $5.40 million in one year.
However, the list of countries with the largest average total cost increase from 2020 to 2021 is somewhat different:
- Latin America (52.4% increase)
- South Africa (50% increase)
- Australia (30.2% increase)
- Canada (20% increase)
- UK (19.7% increase)
- France (14% increase).
Brazil is the only country with a cost decrease of 3.6%, while the ASEAN region saw no change.
(Source: ibm.com)
39. Healthcare has the highest average total cost of a data breach at $9.23 million.
While cyber attacks know no difference between industries, some verticals suffer more losses than others. Healthcare is the industry with the highest average total cost of a data breach at $9.23 million. Healthcare also has the highest increase between 2020 to 2021 at $2.10 million.
In the second place, we have the financial sector, with the average total cost of a data breach at $5.72 million, a slight decrease from the $5.85 million costs recorded in 2020. Pharma is in third, with an average total cost of $5.04 million.
The energy sector has the highest decrease out of all verticals examined. The average total cost of a data breach in 2020 was $6.39 million. This cost dropped to $4.65 million in 2021, which was a 27.2% decrease, making the energy sector drop from second to fifth place.
(Source: ibm.com)
40. Lost business is the category with the highest average total cost of a data breach at $1.59 million in recorded losses.
The total costs of a data breach can be grouped into four categories: lost business, post-breach response, notification, and detection and escalation.
Lost business is the category with the highest average total cost of a data breach with a share of 38%, translating into $1.59 million in recorded losses. These costs include anything ranging from business disruption and revenue losses to system downtime, as well as the cost of lost customers and subsequently acquiring new customers.
In the second place, we have detection and escalation costs, with an average total cost of $1.24 million that equals 29% of losses, followed by post-data breach response ($1.14 million – 27%) and notification ($0.27 million – 6%).
(Source: ibm.com)
41. Customer PII is the costliest type of lost or stolen record, with an average loss of $180 per record.
Not all data breaches cost the company the same amount. The most costly are lost or stolen Customer PII records. These types of records can generate a cost of $180 per record on average. The second most expensive type of record is Employee PII ($176 per record).
In the third and fourth positions, we have Intellectual property ($169 per lost or stolen record) and Other sensitive data ($165 per record). Surprisingly, having your anonymized customer data breached is also expensive, averaging $157 per record.
(Source: ibm.com)
42. From all of the attack vectors in 2021, compromised credentials were the most common, amounting to 20% of overall breaches and generating $4.37 million in costs.
There are ten common initial attack vectors. Each one of them comes with a different frequency and cost. In 2021, the top three most common methods of gaining unauthorized access to a network by the proportion of breaches were:
- Compromised credentials – 20% ($4.37 million in costs)
- Phishing – 17% ($4.65 million in costs)
- Cloud misconfiguration – 15% ($3.86 million in costs)
The cyber attack methods with the highest costs go as follows:
- Business email compromise – $5.00 million in costs
- Phishing – $4.65 million in costs
- Malicious insiders – $4.61 million in costs
- Social engineering – $4.47 million in costs
- Compromised credentials – $4.37 million in costs.
Examining the frequency of specific attack vectors in 2020 and 2021, it becomes clear that phishing became more common, climbing to the second position, while cloud misconfiguration became less common, ending in the third position.
Between 2020 and 2021, vulnerabilities in third-party software fell from third to fourth in frequency. In 2021, it was the initial attack vector in only 14% of breaches, while in 2020, it was the initial attack vector in 16% of breaches.
(Source: ibm.com)
43. If it takes more than 200 days for a company to detect a breach, an average of $4.87 million in costs will be generated.
A data breach lifecycle is a time that elapses between the first detection of a breach and its eventual containment. If it takes more than 200 days for a company to detect a breach, the average cost generated will be $4.87 million.
Even organizations with fully deployed security AI and automation are vulnerable. The average cost of a data breach in these companies was $2.90 million. Organizations with 81-100% of employees working remotely also recorded a high average cost of a data breach at $5.54 million.
Staying compliant can make a difference to security and costs. Organizations with many and frequent compliance failures had to cover an average of $5.65 million in data breach costs.
(Source: ibm.com)
44. The average data breach lifecycle was one week longer in 2021 than it was in 2020.
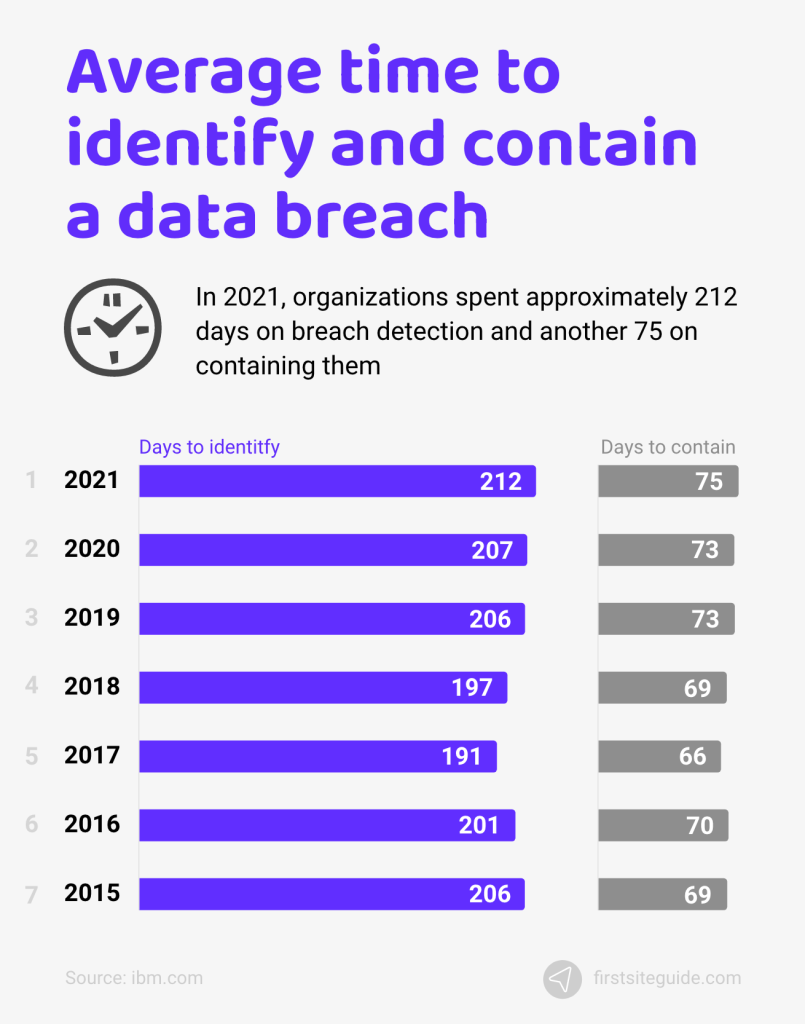
In 2021, organizations needed one more week than in 2020 to contain a data breach. The time required to detect a breach continues to be high. In 2021, organizations spent approximately 212 days on breach detection and another 75 on containing them. This means that we are dealing with a 287-days long lifecycle.
To make it clear, if a breach occurs on April 1st, chances are high that a company could not contain it until January 14th of the next year.
(Source: ibm.com)
45. A data breach lifecycle of fewer than 200 days incurs 30% lower costs than a longer data breach lifecycle.
The longer a data breach lifecycle is, the more costly it will be. In fact, lifecycles that are shorter than 200 days incur 30% lower costs than lifecycles that last longer. In 2021, if a company spent over 200 days to identify a breach, it incurred an average of $4.87 million in costs. On the other hand, if it took less than 200 days, it incurred an average of $3.61 million in costs.
Subtract these numbers, and you can see that the existing gap of $1.26 million is, in fact, the difference of 29.7% discussed earlier. Compared to the figures from 2020, the gap between these two types of breaches increased by $240,000.
(Source: ibm.com)
46. From all factors contributing to data breach costs, amplification compliance failures have the most impact, generating a whopping average of $5.65 million in costs.
How do organizations with a high level of compliance failures compare to those with low levels in terms of data breach costs? There is no surprise here. Companies with high compliance failure levels experienced an average data breach cost of $5.65 million. This includes resulting fines, penalties, and lawsuits.
On the other hand, companies with low compliance failure levels experienced an average data breach cost of only $3.35 million. It is an understatement to say that difference is statistically significant given that it amounts to $2.3 million or 51.1%.
(Source: ibm.com)
47. Organizations with zero trust security architecture installed experienced an average data breach cost of $5.04 million.
Zero trust security architecture is still penetrable, potentially resulting in average data breach costs of $5.04 million. This architecture relies on AI and analytics. It uses AI to validate data, resources, and connections between users, assuming that user identities or the network are already compromised by default.
Only 35% of organizations have partially or fully deployed zero trust security architecture.
(Source: ibm.com)
48. The proportion of organizations with fully or partially deployed security AI and automation has increased by 6% from 2020 to 2021.
The results of the IBM study shed light on the state of security AI and automation adoption rates:
- 25% of organizations fully deployed security automation.
- 40% of organizations partially deployed security automation.
- 35% of organizations still haven’t deployed security automation.
Compared to the figures from 2020, this shows an increase of 6% in the share of organizations that fully or partially deployed security AI and automation. In 2020, the percentage of organizations that fully or partially deployed security automation was only 59% compared to 65% in 2021. This means that organizations are slowly but steadily starting to see the value of security automation.
(Source: ibm.com)
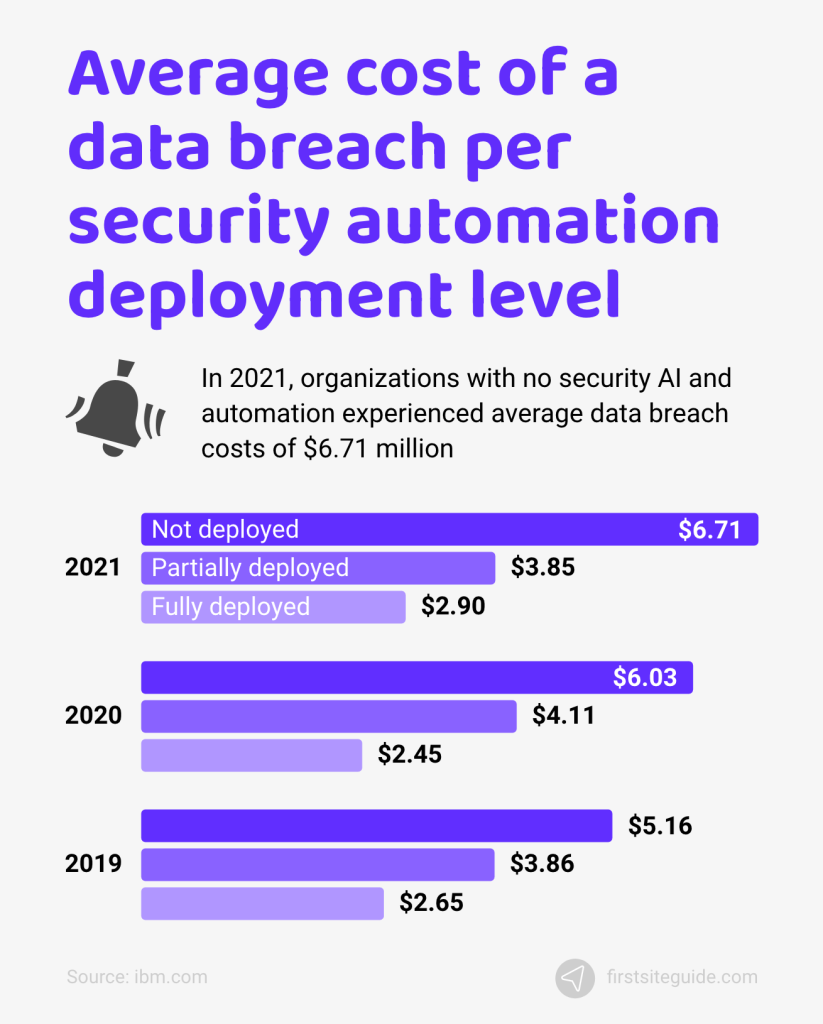
49. Organizations with high security AI and automation levels experienced the most significant data breach-related cost savings.
The difference in data breach-related cost savings between organizations with security AI and automation and those without is significant. In 2021, organizations with no security AI and automation experienced average data breach costs of $6.71 million, compared to organizations with fully deployed security automation that witnessed average breach costs of only $2.90 million.
The difference in costs in 2021 was $3.81 million, which is even more significant than the difference from 2020. In 2020, organizations without security AI and automation experienced average breach costs of $6.03 million, while those without saw average breach costs of $2.45 million. The cost of a breach in all deployment levels exhibits positive growth in either case.
(Source: ibm.com)
50. It took organizations with fully deployed security AI and automation 184 days to identify and 63 days to contain a data breach, resulting in a data breach lifecycle of 247 days in total.
It’s logical to assume that organizations with fully deployed security AI and automation experience shorter data breach lifecycles than those who are partially and not deployed. Here are the numbers.
Organizations with fully deployed security automation spent, on average, 184 days identifying the breach and 63 days containing it. So, 247 days in total.
Organizations with partially deployed security AI and automation spent approximately 212 days identifying a breach and 77 days containing it, which amounts to 289 days in total. And finally, organizations with no security AI and automation solutions whatsoever spent 239 days identifying and 85 days containing a breach on average, totaling 324 days.
(Source: ibm.com)
51. The hybrid cloud model’s average total cost of a data breach was $3.61 million compared to the public cloud model’s average total cost of a breach at $4.80 million.
Out of three cloud models, the hybrid cloud appears to have the lowest average total cost of a data breach. In 2021, its average total breach cost was $3.61 million. Beaches in private clouds amounted to an average cost of $4.55 million, while the public cloud had the highest average total cost of a breach at $4.80 million.
(Source: ibm.com)
Conclusion
After carefully reviewing the statistics, it has become clear that cyber attacks are pervasive and growing. Compromised credentials, phishing, and misconfigured cloud solutions will most likely continue to be the primary attack vectors paired with the rise of misinformation campaigns and AI-powered fake news 2.0.
As you can see, the cybersecurity industry doesn’t sit idle. Security AI and automation solutions can mitigate most cybersecurity risks and minimize the costs of a data breach. Stay tuned as we continue to cover the most relevant hacking stats!