The Best Web Analytics Tools in 2024
10 Web Analytics Software to Track Your Business Performance

Are you interested in finding out if your website is generating enough customer conversions and how your business fares against the competition?
If your answer is yes, what you need is a sophisticated web analytics software solution. Then again, if you are not exactly sure what web analytics software does, there is no reason to worry because I am going to tell you all that you need to know. I’ll also explain how to choose the best web analytics tool for your online business.
After spending hours delving deep into all aspects of both free web analytics tools and paid ones, I have managed to compile a list of the best web analytics tools for eCommerce and small businesses, along with the pricing lists for paid options.
EDITORS’ CHOICE
With data generated using website analytics software, you will be able to find out how many visitors come to your website, how much time they spend there, and what percentage of them subscribe and buy something. Plus, plenty of other useful information that will help you to drive your business further and ultimately boost your revenue.
The top 10 most popular web analytics tools
Here’s my list of the top 10 most popular web analytics tools that companies worldwide rely on to generate valuable intel about the performance of their website and business.
- Google Analytics Turning data insights into action
- Similarweb Similarweb measures the digital world
- Clicky Analyze traffic in real-time
- Matomo Website analysis with 100% control
- Finteza Advanced web analysis and evaluation
- Woopra Understanding the customer journey
- Chartbeat Measure customer engagement
- Hotjar Understanding site traffic and data
- Crazyegg Detailed analysis of websites
- Mixpanel Web analysis and data science
Google Analytics — Turning data insights into action
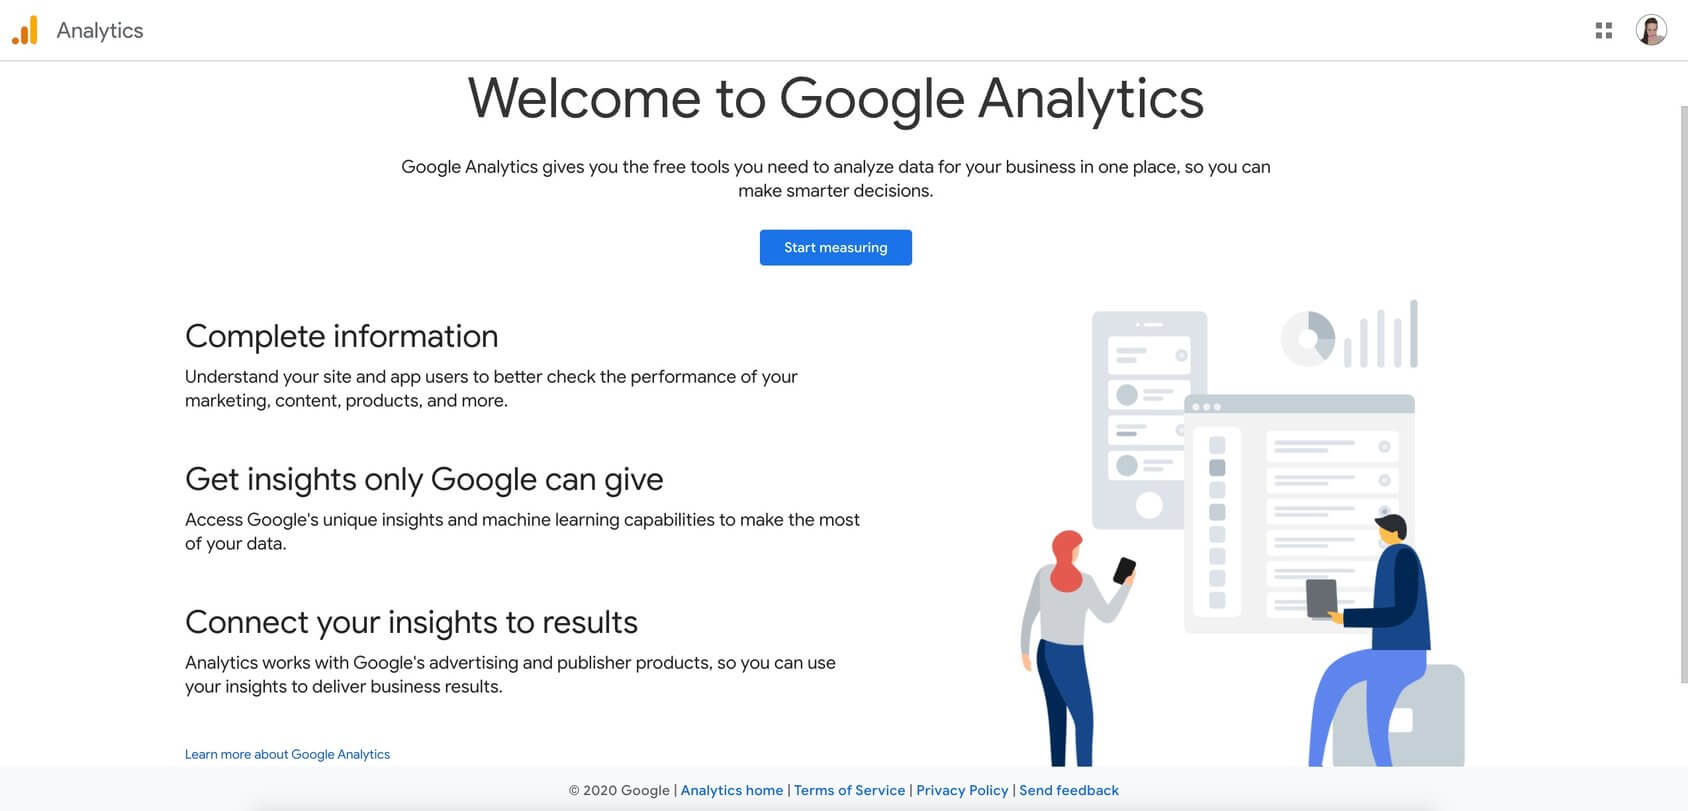
Google Analytics is the most robust platform for web analysis in the world, with around 30 million websites actively using it.
Google Analytics is by far the biggest web analytics platform in the world, and for good reason. It offers both free and paid tools to websites that can, in turn, use them to obtain a deeper understanding of their customers and their behavior. Regardless of the industry, be it travel, healthcare, retail, or any other, Google Analytics can provide a complete view of how customers engage with your content, what is being successfully implemented, and what is not.
Google Analytics offers a free plan which is perfect for small and medium enterprises. The free plan is jam-packed with useful features that cover everything from data analysis, reporting, data collection and management, integrations, and more. However, there is also a paid premium version called Google Analytics 360 which is a perfect fit for larger enterprises that need everything the Google Marketing Platform has to offer.
Google Analytics employs sophisticated machine learning that helps users in multiple ways. For example, with the data generated from analytics, you can measure conversions, examine the best sessions on your site, and transfer them into Smart Goals. Smart Goals will help you to organize bids, ads, and your website to ensure maximum conversion. With artificial intelligence processing your data, you will get information about which users are most likely to convert in their upcoming sessions.
Also, there are various levels of data manipulation, monitoring, and filtering, such as funnel analysis, segmentation, monitoring progress on dashboards, and many other methods to help you get the best out of the gathered information.
Key features
- Full performance insight — get a complete insight into the performance of your business, and have all your questions about the data answered.
- Reporting — receive various reports on the ways in which customers interact with your site and apps.
- Multiple data access points and organization tools — through data filtering and manipulation tools you can easily visualize your data, customize it, and segment it.
- Data management and user access control — Google Analytics allows for easy data import from third-party sources and the highest level of user access control.
- Data implementation — thanks to the analytical tools that supply you with valuable information, you can implement the findings to configure your website and apps.
- Easy integration — Google Analytics works perfectly with other Google solutions.
Pricing and plans
Google Analytics is mostly a free platform available for all, but there is also a paid version with even more features and characteristics for more advanced users.
Free plan
- Free of charge
Google Analytics is a free platform available for all and offers multiple tools, such as data import, URL builders, multiple integration options, and more.
Google Analytics 360
- $150,000 per year
The paid plan includes all of the features from the free plan as well as unsampled reports, BigQuery export, data-driven attribution, and many other additional reporting forms.
SimilarWeb — SimilarWeb measures the digital world
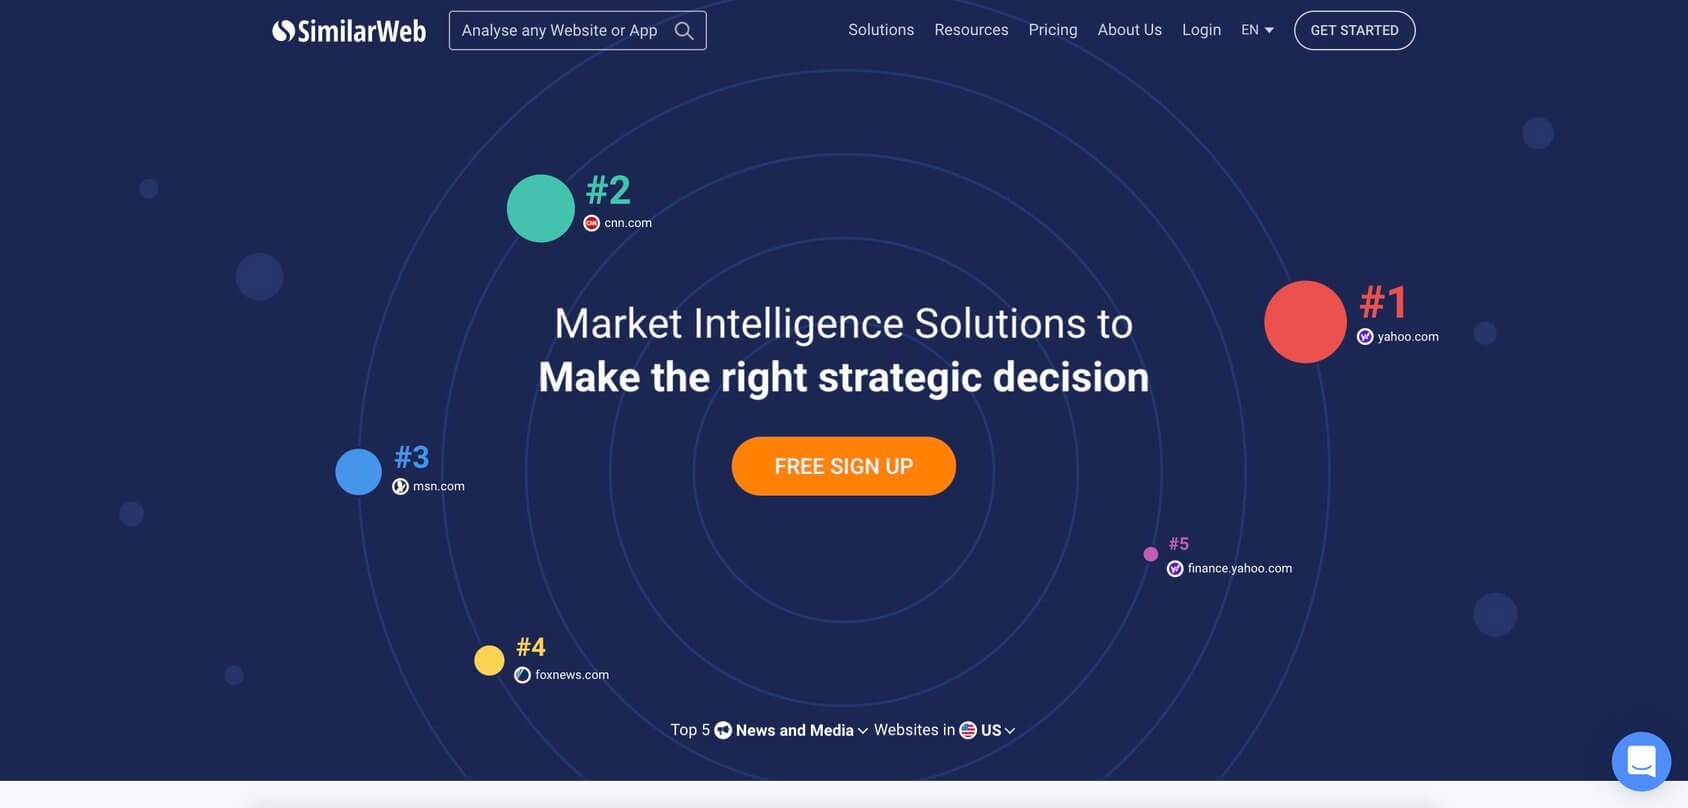
SimilarWeb utilizes multiple methodologies in its approach to data analysis and collection to provide users with a better understanding of their customers.
SimilarWeb is a unique platform for data analysis that gathers information about the performance, traffic, and other aspects of a website from hundreds of different sources and combines it into a single data set.
With that business-specific data set, customers can get unprecedented levels of insight into the behavior of potential clients and website visitors and the most comprehensive analysis of the performance of their app or website.
SimilarWeb’s team of experienced mathematicians and other data scientists process the data through machine learning algorithms to get the prediction models and estimations of future customer acquisitions.
SimilarWeb’s platform gives clients the opportunity to see the current trends in the industry and what strategies can be employed to boost overall success and revenue. Also, SimilarWeb’s website analytics tools gauge the effectiveness of the competition’s customer acquisition so that you can make the necessary comparisons and see what practices can be implemented in your business and where further improvements can be made.
There are various solutions that SimilarWeb offers depending on what you want to accomplish. Whether it is the growth of your business through marketing solutions, or getting more knowledge about your competition and the industry at large so that you can make the best strategic decisions, or simply improving your sales, SimilarWeb has a solution for you.
Key features
- Traffic and engagement measuring — helps you see how your business fares against the competition and how much time your visitors spend on your site, page views per site, etc.
- SEO and PPC — gives you insight into your organic and paid keywords, and how much traffic they generate.
- Affiliate traffic — helps you to see what affiliates drive traffic to your competitors so that you can find new affiliates for your business.
- Marketing strategy — compares different marketing-channel data to optimize your marketing strategies.
- Funnel analysis — helps you learn about funnel leakage and performance metrics that provide information about which marketing channels provide the highest conversion rates.
Pricing and plans
SimilarWeb offers a free plan which gives you the chance to test the service before switching to the paid version and getting even more out of the platform.
Free plan
- Free of charge
The free plan from SimilarWeb gives you three months of web traffic data, followed by a month of mobile app data, and five results per metric.
Enterprise
- Price upon request
Enterprises that want the complete version of the platform can enjoy unlimited results per metric, up to 28 months of mobile app data, access to global and country-specific data, keyword analysis, and much more.
Pricing for the paid program depends on the services you want to use, the size of your business, and many other factors. What usually comes out to a five-figure price is paid on an annual basis. You need to contact customer support at SimilarWeb for specific details and pricing for your business.
Clicky — Analyze traffic in real-time
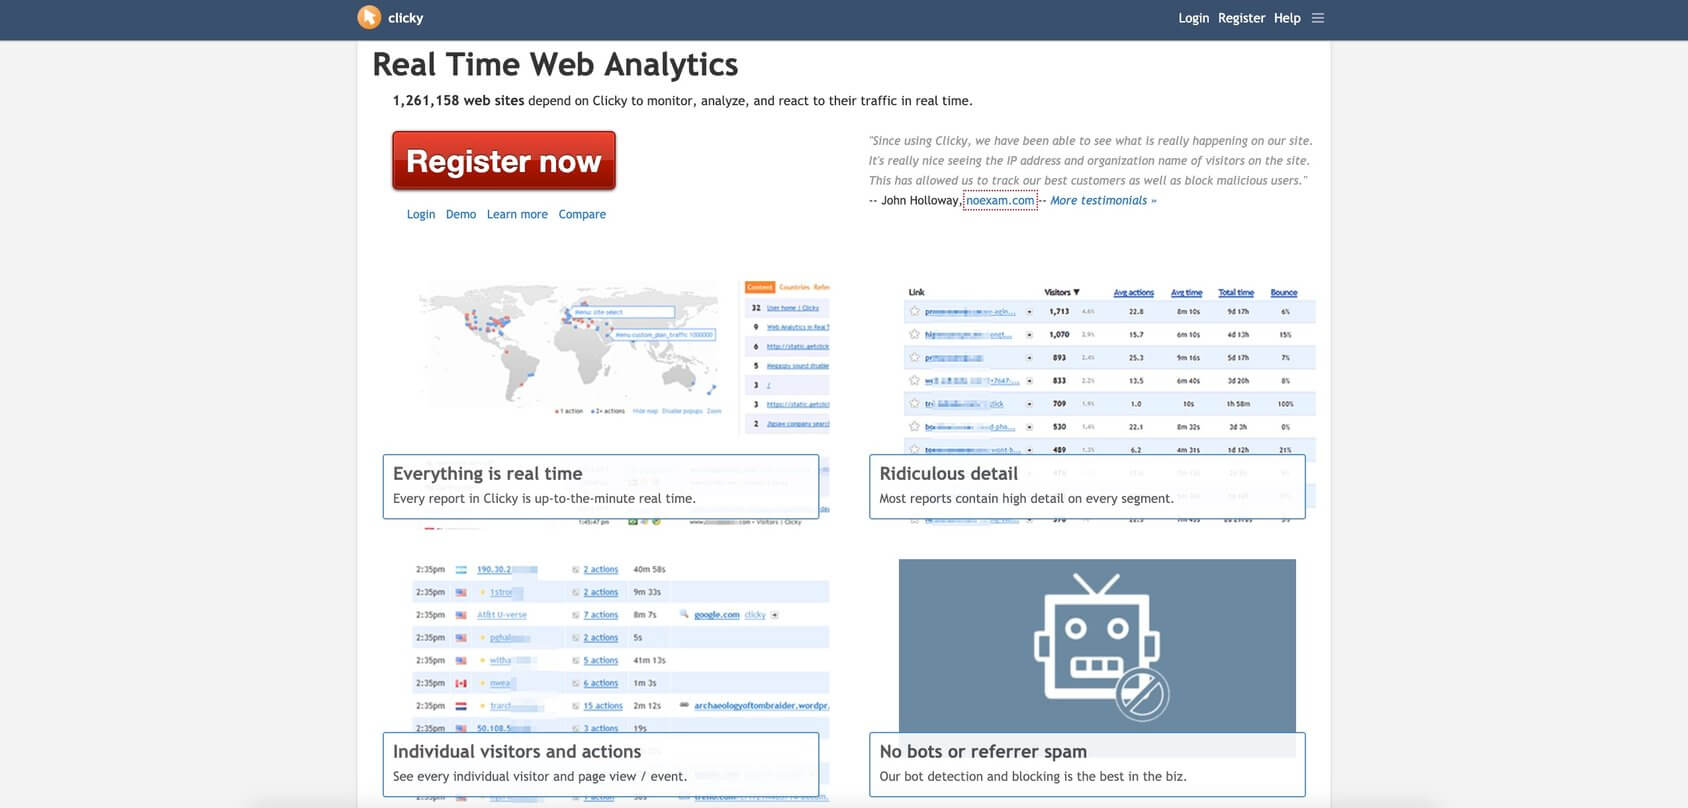
Clicky is a website analysis tool that allows website owners to track the activity on their websites in real-time through a simple user interface.
Clicky is a web analytics platform that has been around for over 13 years, helping websites and business owners monitor online action at any given moment. It is often described as a user-friendly alternative to Google Analytics with many of the same features, but with a much clearer view of the data.
Clicky is a very simple tool to use, which is probably one of the main reasons why more than 1.2 million sites rely on it to monitor their traffic. To start using Clicky, users first need to register an account. After that, an admin site key will be provided, together with a tracking code that needs to be installed manually into the organization’s template, or you can use a plugin from Clicky. Once this process is completed, the tracking of website visits begins.
Clicky is there to register every visit on your site, plus the location of every visitor, where the visitors were referred from, how much time they spent on your page, what sort of actions were registered, and even heatmaps for every individual visitor. All in real-time.
Clicky relies on widgets and dashboards to provide its clients with enough customization options and a clear overview of everything that goes on at their sites.
Where Clicky does a perfect job is getting a huge amount of on-site analytics to website owners in real-time. Moreover, there are no bots and referrer spam thanks to their state-of-the-art protection systems. You can also use heatmaps by visitor, page, or segment in real-time.
Clicky has both a free version and a paid one, and the difference between the two is reflected in the number of websites you can follow, and the availability of special features. The good thing is that all new users automatically get a free 21-day trial of premium features that they can use on up to 3 websites, as well as up to 1 million visits on all sites.
Key features
- API — analytics API allows for easy extraction, analysis, and storage of website data in several formats.
- Bounce rate — Clicky’s bounce rate tells you exactly how much time a visitor spent on your site with extra accuracy.
- Content reports — visitors receive detailed reports about the most active pages on the site, the downloads from the page, as well as video and audio activities.
- Heatmaps — heatmaps show where the users are clicking while on your site.
- Twitter analytics — this analytics tool lets you monitor all mentions of your account, website, or anything else on Twitter.
Pricing and plans
Clicky has several paid programs and a single free one. Subscriptions can be paid on a monthly or yearly basis, which can bring extra savings. Remember, all new users automatically get a 21 day free trial with premium services upon registration.
Free plan
- Free of charge
With the free plan, you can track a single website with up to 3,000 daily visits. Unfortunately, there are no premium services, heatmaps, and uptime monitoring available on the free plan.
Pro plan
- $9.99 a month
- $79.99 a year
Up to 10 websites tracked with up to 30,000 total daily visits. This plan includes standard and premium features.
Pro Plus
- $14.99 a month
- $119.99 a year
Tracking allowed for up to 10 websites with up to 30,000 total daily visits. This plan includes premium features, plus heatmaps and uptime monitoring.
Pro Platinum
- $19.99 a month
- $159.99 a year
Clients can track up to 30 websites with up to 100,000 total daily visits. This plan encompasses premium features, plus heatmaps and uptime monitoring.
Custom plan
- Custom pricing according to requirements
The custom plan lets you monitor up to 1,000 websites with up to 20 million daily visits. The price for this program varies based on multiple factors, so you’ll need to contact customer service for more details.
Matomo — Website analysis with 100% control
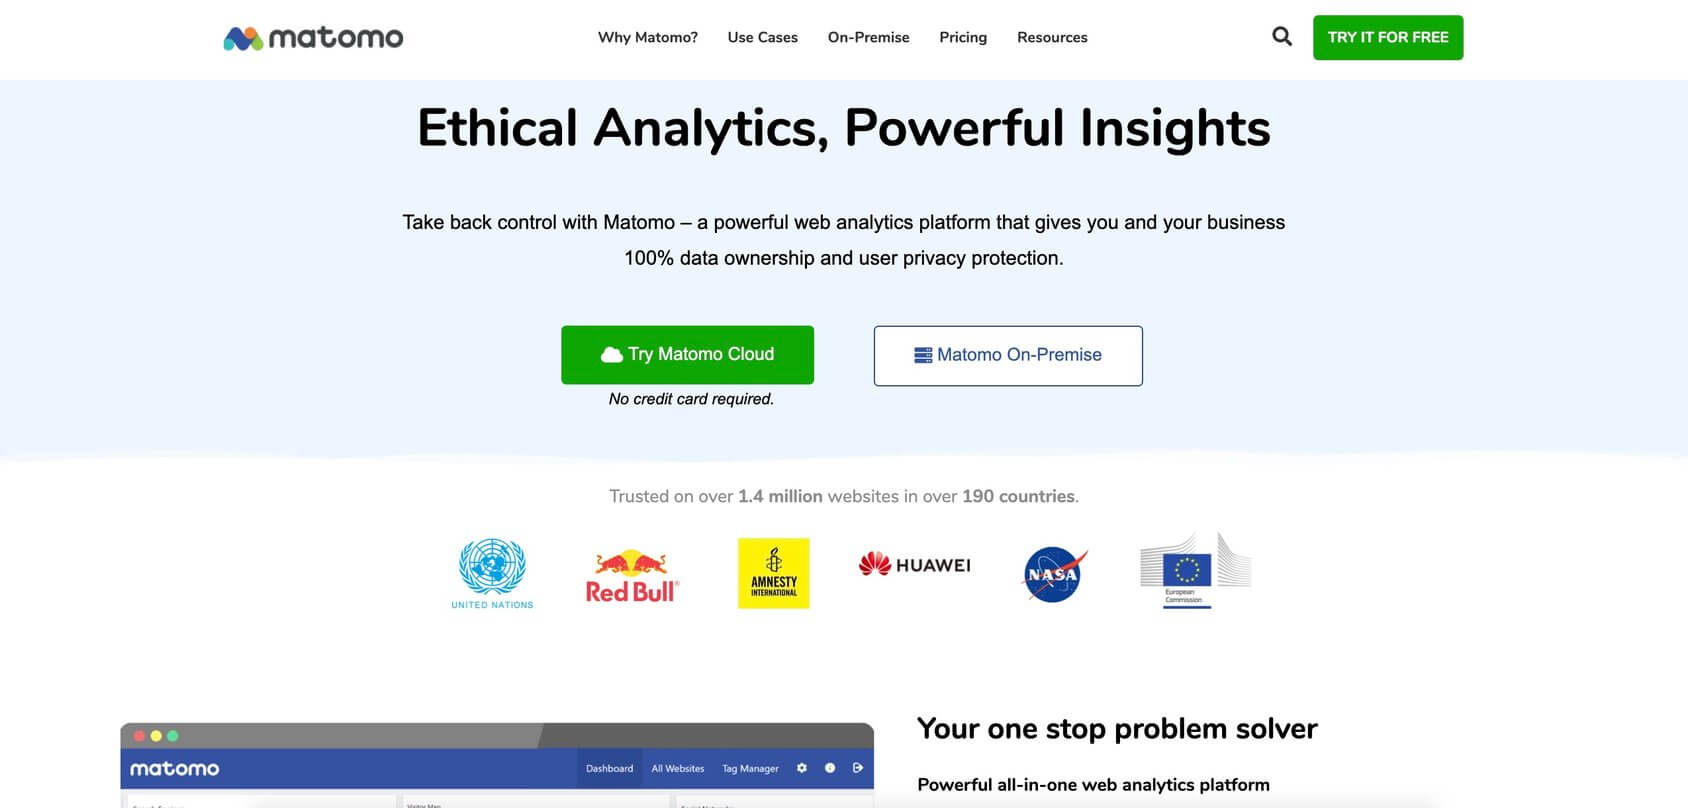
Matomo is a web analysis tool that gives its users complete control of all data generated on their platform.
Matomo is a website analytics tool currently present in over 190 countries and with over 1 million active users. It is a powerful tool that allows you to track the entire customer journey on your website.
One of the biggest selling points of Matomo is that not only is it a feature-rich platform but also the fact that Matomo allows the user to have 100% data control and full ownership and protection of all sensitive data. This means that no third-party will ever gain access to your sensitive data as all information will be stored on your servers with an on-premise Matomo solution. Even if you opt for the Matomo cloud, you will still be the sole owner of the data and Matomo won’t ever sell your data to any third-parties.
Matomo analytics is in compliance with the strictest privacy laws, such as GDPR, HIPAA, CCPA, and PECR, so you don’t need to worry about any legal issues. Also, Matomo is a user-friendly tool offering many customization options that allow you to adjust the functions of the platform to the needs of your business.
The complete website analytics package from Matomo provides its users with custom reporting, event tracking, and a set of other tools that lead to better conversion rates, such as heatmaps, funnel analysis, session recording, A/B testing, and much more.
Key features
- Ultimate visitor tracking — this feature gives users complete access to the entire history of actions taken by the site visitors, from their location, the devices they used, their browser, to the time spent on your site, the entry and exit patterns of visitors, and more.
- Session recordings — session recording allows owners to see their website from the visitors’ point of view, and playback the interactions to see, for example, how many clicks are needed to navigate to a specific section of the website.
- Multi-attribution models — gives an estimate of marketing channels and their success.
- Google Analytics import — import historical Google Analytics data into Matomo.
- Roll-up reporting — roll-up reporting aggregates data from multiple sites and apps into one account.
- SEO keywords — maximization of SEO efforts with the right keywords.
- Heatmaps — learn how far down the page most visitors scroll, where they click, and more.
Pricing and plans
There is a 21-day free trial period for every newly-registered user, so you can test Matomo before opting for the paid plan. The price of the paid plans also depends on the form of the platform used and monthly traffic (page views start from 50,000 to 50 million and more). The greater the number of features used and monthly traffic to your site(s), the higher the price.
Cloud hosting Essential plan
- $19 per month
Ethical web analytics, good for 3 websites, 3 team members, and 6 months of raw data retention.
Cloud hosting Business plan
- $29 per month
Ethical web analytics, good for 30 websites, 30 team members, and 24 months of raw data retention.
Cloud hosting Enterprise plan
- Price upon request
This plan includes custom limits and features.
Matomo on-premise
- Free download
This plan lets you self-host Matomo analytics for free with paid additional premium features.
Matomo for WordPress
- Free of charge
The WordPress plan is free to use with free premium features and no data limits.
Finteza — Advanced web analysis and evaluation
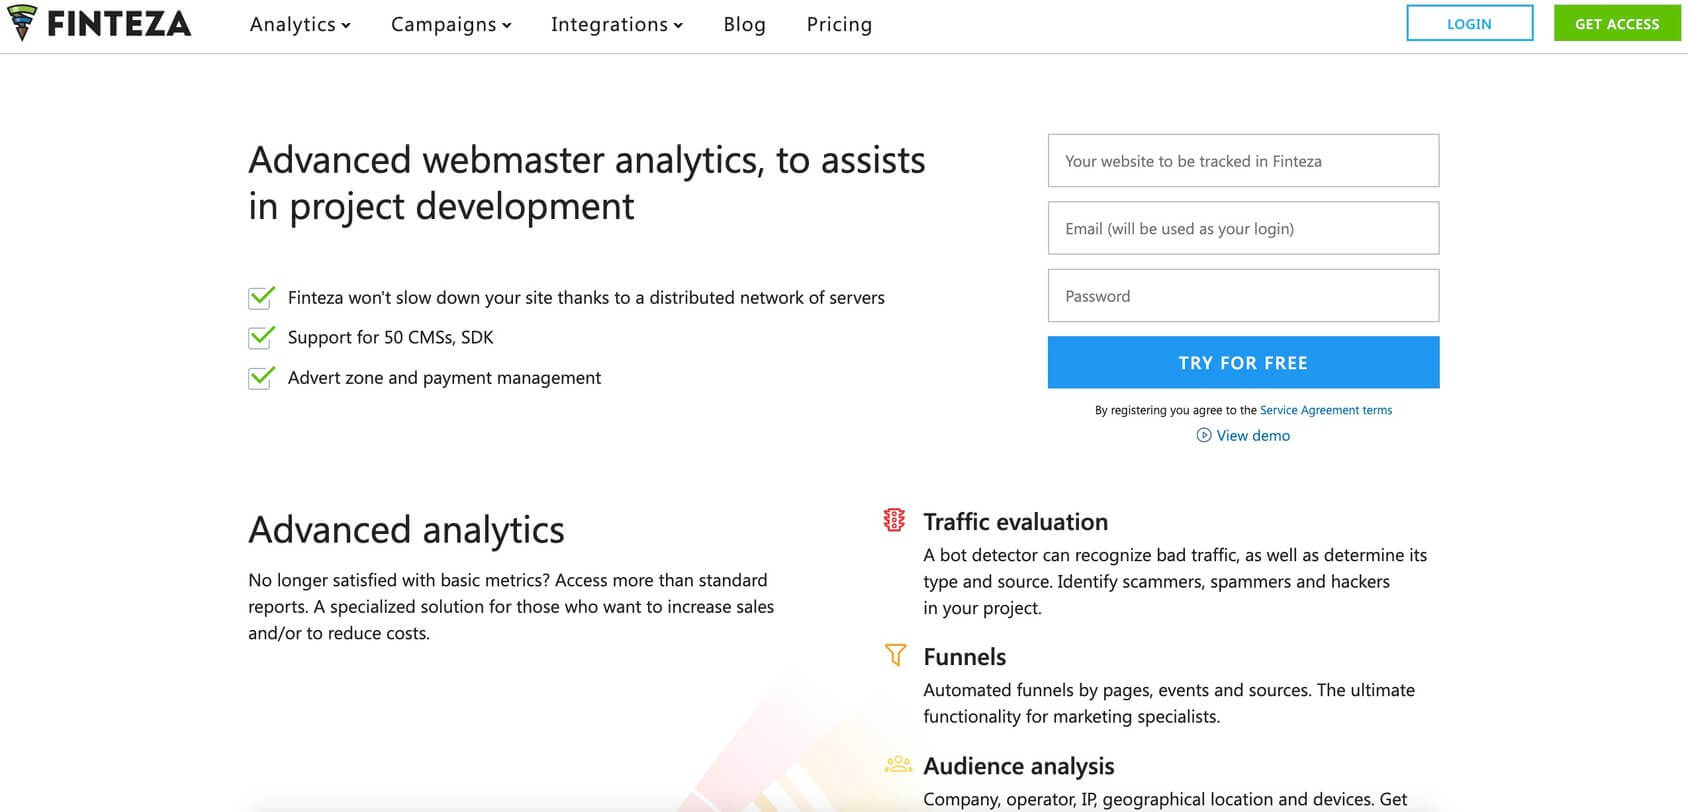
Finteza is a cloud-based analytics solution that provides advanced web traffic analytics in real-time.
Finteza delivers an all-in-one web-traffic analytics solution that helps businesses obtain a better understanding of user behavior and manage advertising campaigns more efficiently. Finteza helps websites tackle some of the biggest issues in web traffic analysis.
As one example of how Finteza helps, a bot detector will recognize bad traffic and identify potential scammers and hackers, so that your information will be based solely on real data.
Also with Finteza, you can customize conversion funnels and create funnels for any desired page, source, UTM tag, and more. With these customization options, you will have a detailed behavioral analysis of your audience at any stage.
Moreover, Finteza gives detailed reports on the characteristics of your audience, starting with the device type and model they are using when browsing your site, the provider, IP, browser, geographical location, and language, without breaching their privacy.
Last but not least is the fact that Finteza does not do data sampling, so all of the results you get are accurate and have been processed.
Key features
- Audience analysis on 15 parameters — visit sources, UTM parameters, page addresses and more.
- Detailed reporting in real-time — you will receive detailed visitor analytics in real-time.
- No bot traffic — a bot detector recognizes bad traffic and finds its source.
- Page analytics — monitor page traffic and compare findings.
- Customized sales funnels — customers can visualize all data in the form of a funnel and see where improvements can be made.
Pricing and plans
Every new client gets a 30 day free trial from Finteza. After that, they can opt for a paid plan.
Paid plan
- $25 per 100,000 unique users a month
The paid plan for website and application analytics is $25 per month, and it comes with a built-in bot detector, 15 types of audience reports, and event-based sales funnels.
Woopra — Understanding the customer journey
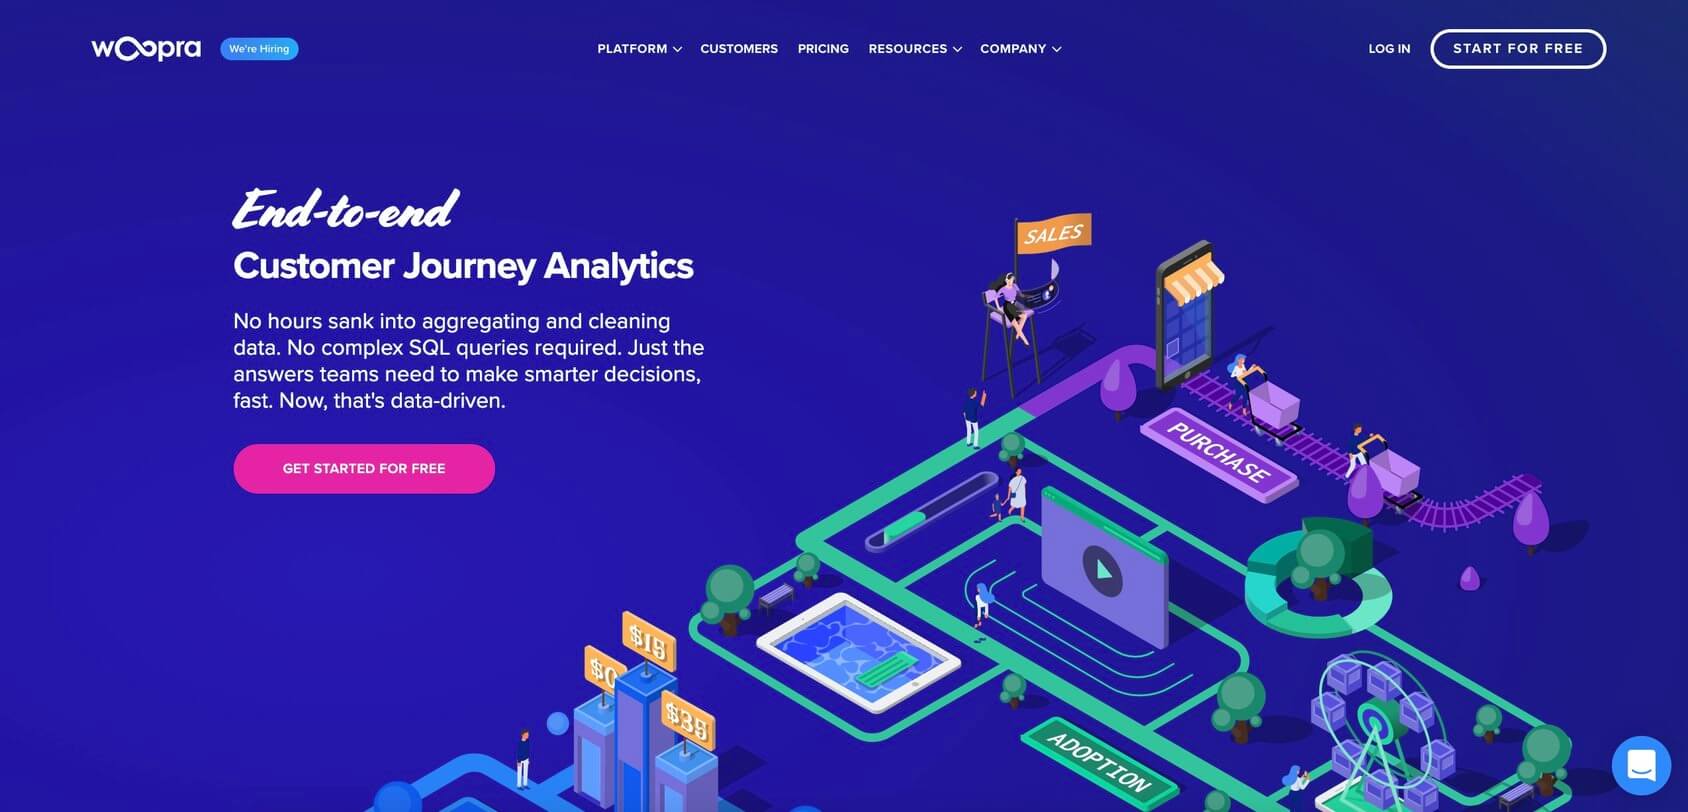
Woopra is an analytics platform that lets businesses get to know their customers through multiple touchpoints.
Woopra is all about understanding the consumer journey from the moment they “set foot” on your site. This helps companies analyze their behavior and ultimately engage and retain those visitors and turn them into loyal customers.
Woopra uses proprietary technology to provide you with details on individual customers, called People Profiles, where you can see the entire customer journey for each visitor of the site.
To analyze and optimize the customer experience, Woopra offers a suite of integrations, with over 50 different platforms such as Salesforce, Zendesk, and many others.
Key features
- Advanced real-time reporting — Woopra employs custom-made reports, segmentation, and other real-time reporting systems.
- Customer profiles — each customer has a unique profile with data including email, live chat, and help desk conversations.
- Third-party integration — there are over 50 one-click integrations to unify all customer data.
- Complete metrics — take note of every point in the customer journey, from entry pages to conversions and exit pages.
- AppConnect — customer data is gathered from various sources enabling marketing automation, and social media integration.
Pricing and plans
There are three different plans you can choose with Woopra and each plan comes with a series of distinct features.
Free plan
- Free of charge
The Core plan is a free plan that comes with 500k actions per month and 90 days of data retention. All of the core features are available, but the premium ones, such as behavioral segmentation, are not.
Pro plan
- $999 per month
The Pro plan brings 5 million actions per month, 24 months of data retention, premium support, and advanced premium analytics tools.
Enterprise plan
- Contact customer support
The Enterprise plan is tailored to your business, and you can get over 50 million actions per month, more than 2 years of data retention, special support, and more.
Chartbeat — Data analysis platform for publishers
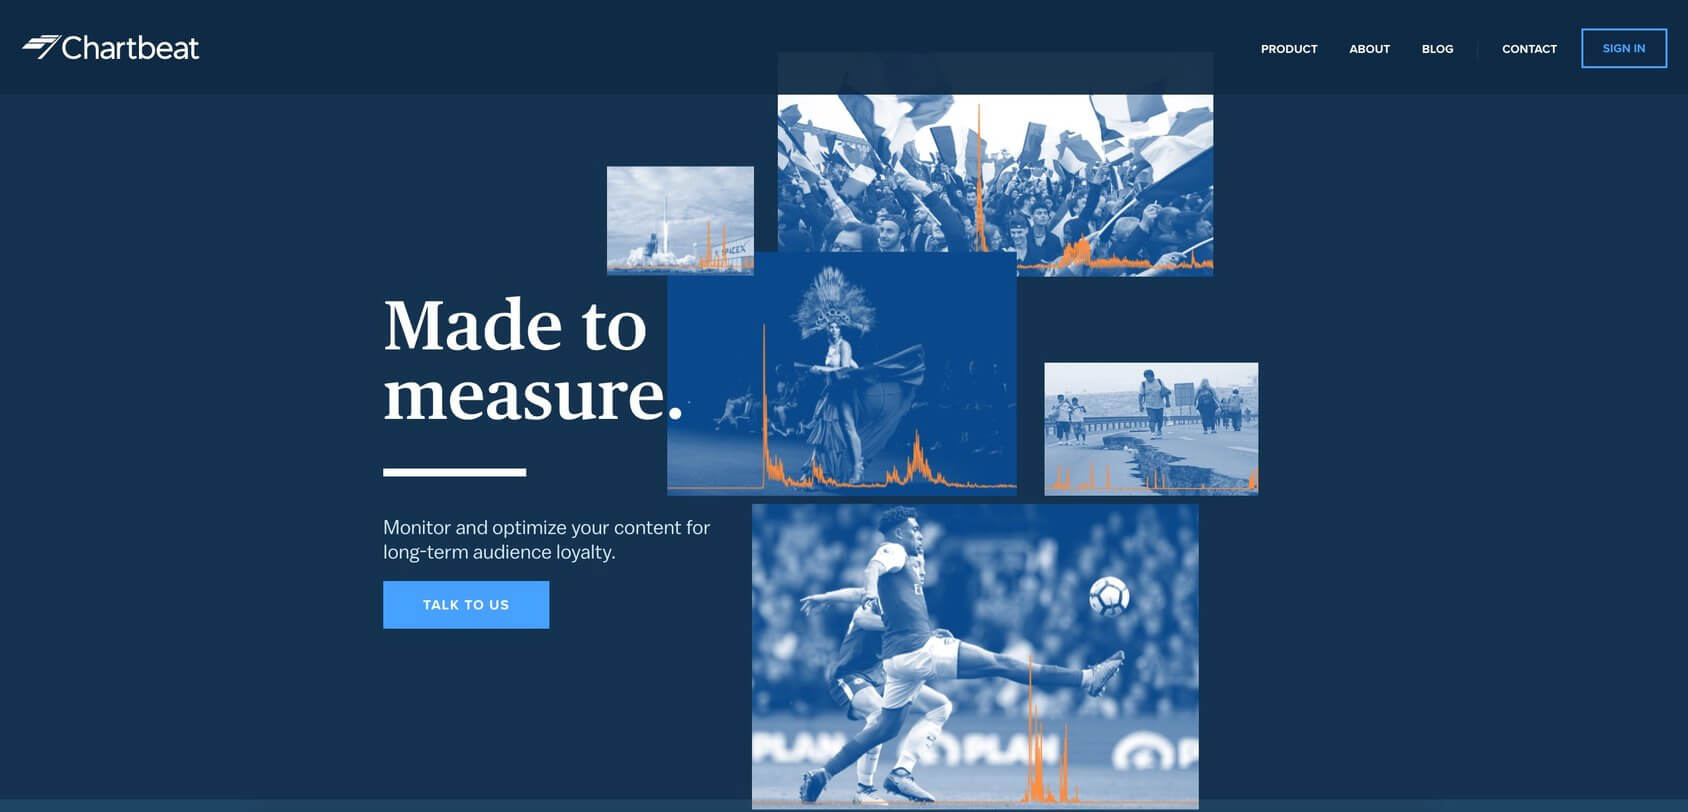
Chartbeat is a platform designed for publishers and similar organizations to track reader engagement.
Chartbeat allows companies to establish a network of loyal customers with the help of real-time as well as historical analysis of data coming from multiple platforms.
Chartbeat has partnered with over 60,000 media brands and conducts business in over 60 countries worldwide. Through Chartbeat’s dashboards, reporting systems, headline testing, and other optimization tools, publishing organizations have managed to gauge their business value and learn what kind of written and video content keeps readers interested.
Key features
- Real-time dashboard — Chartbeat’s real-time dashboard allows businesses to see how users reach their content and what sort of activities they engage in while on the site.
- Historical dashboard — the historical dashboard delivers a long-term perspective on your audience’s activity, such as page views, average engaged minutes, and more.
- Automated reports — reports including breakdowns and visualizations are sent out via email on a daily basis.
- Heads-up display — the heads-up display is a feature that puts the site’s traffic and other data right onto your home screen or landing page in real-time.
- Headline testing — headline testing is a feature that tests what kinds of headlines are most successful when it comes to getting people to click on and read content online.
Pricing and plans
There are three different plans on offer at Chartbeat: Basic, Plus, and Premium. Each of these plans has a distinct set of features.
Basic plan
- Price upon request
The basic plan has the standard features, like the heads-up display, real-time and dashboard reports, but lacks the special features like advanced queries and headline testing.
Plus plan
- Price upon request
The Plus plan has all of the same features as the basic plan, plus it allows users to choose only one premium feature. You need to contact customer service for further details on pricing as it depends on your selection of features.
Premium plan
- Price upon request
The Premium plan is the most comprehensive Chartbeat plan and has all of the standard features, plus all three premium features — headline testing, advanced queries, and multi-site view.
Hotjar — Understanding site traffic and data
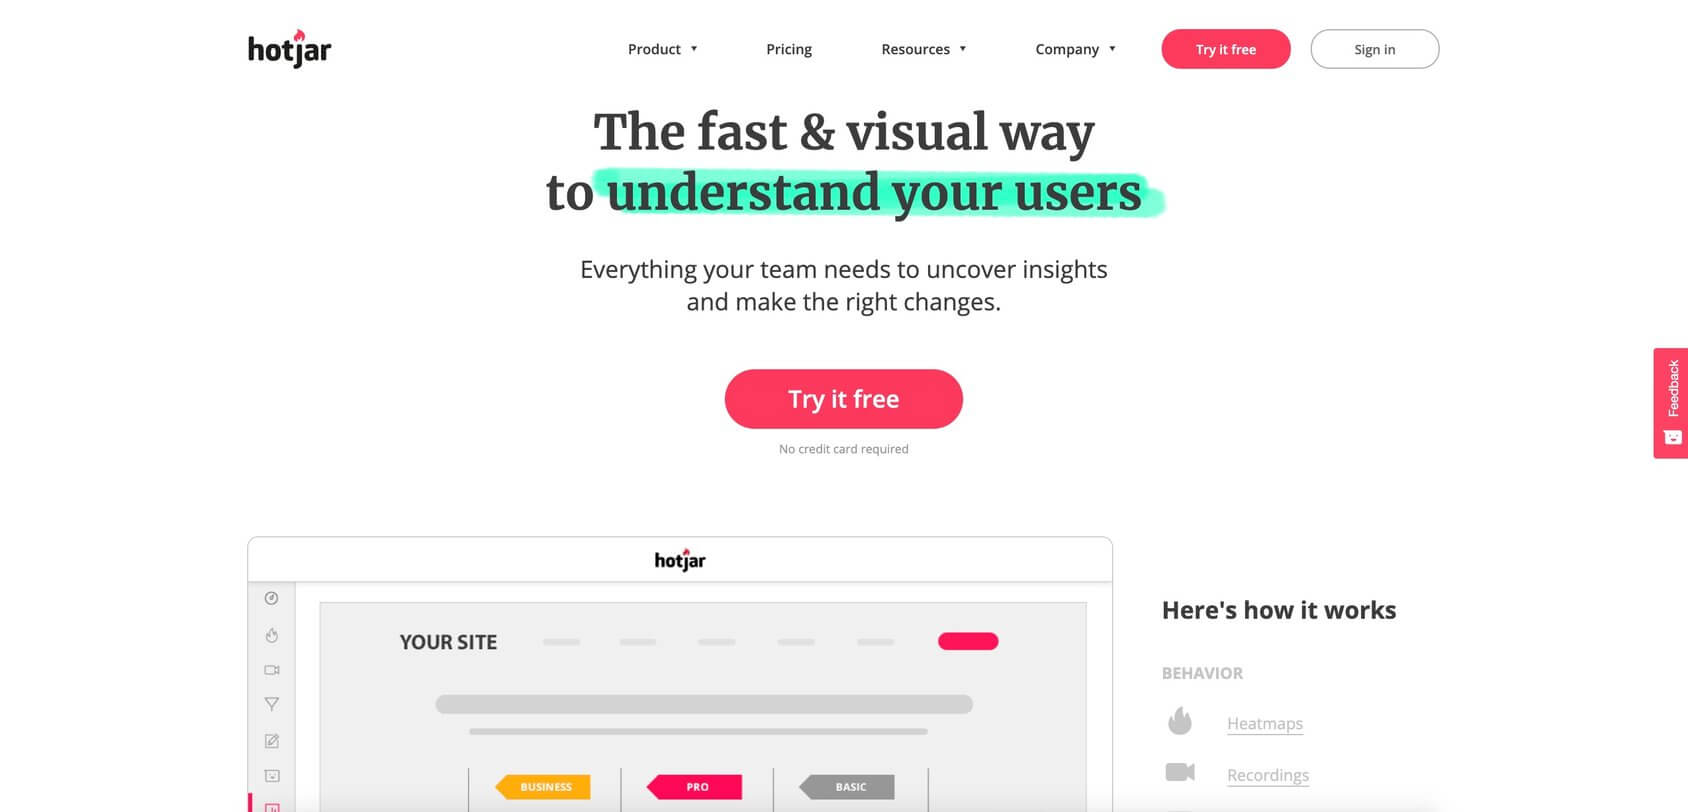
Hotjar is a web analytics tool that has proven to be quite helpful for marketers and companies trying to get a clearer picture of how users behave on their websites.
Hotjar successfully combines different analytics tools and features with a variety of feedback tools into a single solution.
It employs a series of different mechanisms to keep track of user activity, such as heatmaps and visitor recordings. Hotjar also uses polls, surveys, and other methods of getting valuable feedback from users.
With such a detailed collection of data, your marketing, analytics, UX, and CRO teams can make the necessary changes to improve UX and conversions.
Hotjar does not impose limits on how many people on your team can have access to the platform. Also, all of their features work perfectly on desktop and mobile.
Key features
- Heatmaps — get a visual representation of where your visitors click on your site, how far they scroll, and many other user behavior patterns.
- Visitor recordings — with visitor recordings, you can examine real user recordings and see the site from their point of view, so that you can learn more about their experience and how you can improve it.
- Conversion funnels — conversion funnels let you know which points in the conversion process drive visitors away from your site.
- Feedback polls — feedback polls allow you to question visitors about what they want to accomplish on your site so that you can improve their experience.
- Incoming feedback — incoming feedback gives visitors a chance to provide visual feedback on your site.
Pricing and plans
Hotjar has specific plans for personal projects and businesses of all sizes. If you are just looking for analytics on a small personal project, the basic free plan is the perfect option. However, if you want more, you should select one of the paid plans.
Free plan
- Free of charge
The free plan lets you collect data on a site with up to 2,000 page views a day. You will have a limited number of features at your disposal, and the data is stored for only a year.
Plus plan
- $32 per month
The Plus plan is perfect for low-traffic sites and businesses that are in their early stages of development. The plan facilitates up to 10,000 page views a day and offers more features than the free plan. It also includes a 30-day money-back guarantee and a 15-day free trial.
Business plan
- Starting from $80 per month
The Business plan has multiple options for clients, depending on the amount of traffic. The most basic program starts at $99 a month for 20,000 page views daily. All Business plans have premium features not found in other plans.
Agency plan
- Price is set according to individual demands
Agencies and consultants are offered a specific plan with the most advanced options and tools. The price for it is set according to individual demands.
Crazyegg — Improving websites through detailed analysis
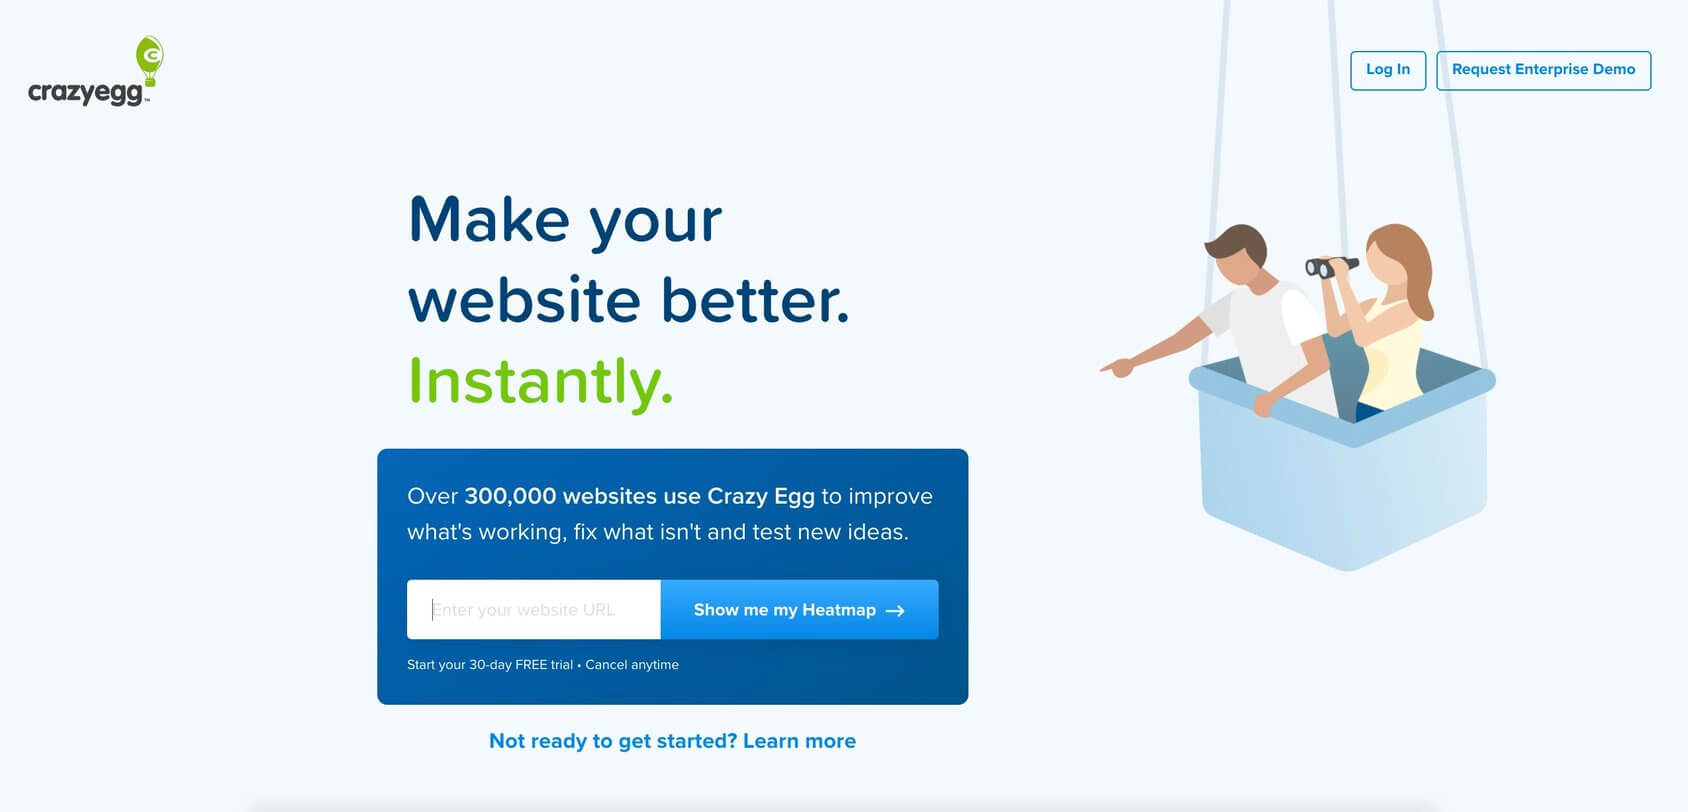
Crazyegg is a platform for analyzing visitor behavior in order to help websites improve UX and ultimately increase ROI and conversion rates.
Crazyegg is famous for its heat-mapping tools and session recordings which are the cornerstones of their website analysis. However, what I like even more is that Crazyegg also allows clients to run A/B tests which help them to improve the design of their websites and the overall customer experience.
The main goal of Crazyegg is to help websites understand how their visitors navigate the site, and how much time they spend there. The tool also helps identify and correct any weaknesses so that visitors can be turned into loyal customers.
Through visual reports, individual session recordings, and other tools, Crazyegg brings you valuable insights that will help with the optimization of your site.
Furthermore, Crazyegg is open to integration with other platforms, such as Drupal, Google Tag Manager, Joomla, and a number of others, which produces further value.
Key features
- Heatmaps and scroll maps — heatmaps and scrollmaps allow clients to track user activity on the page, where they click, how far they scroll, how they see the CTAs, and more.
- Snapshot reporting — digital snapshots of heatmaps and scrollmaps for a better understanding of user behavior.
- Session recordings — session recordings of users’ entire sessions for easier understanding of behavior patterns.
- A/B Testing — put information and insights gathered from heatmaps and session recordings to the test.
- Demo dashboard — potential clients can see a demo version of the Crazyegg dashboard and see how the entire platform operates.
Pricing and plans
After a 30-day free trial period, businesses can opt for one of the five paid plans available. Each plan has unique features, so customers can select the one that best suits their enterprise.
Basic plan
- $29 per month
The Basic plan includes tracking data on sites with up to 30,000 page views a month, and 100 recordings. There isn’t a limit to the number of websites you want to track, and all of the recordings are stored for 3 months. With this plan, you receive an unlimited number of A/B tests.
Standard plan
- $49 per month
The Standard plan has everything the Basic plan offers and more. You can track traffic on an unlimited number of sites with up to 75,000 page views per month. Up to 500 recordings can be made, and they are stored for a year. You can also do an unlimited number of A/B tests and edits.
Plus plan
- $99 per month
The Plus plan allows users to track activities on an unlimited number of sites with up to 150,000 page views per month. Up to 1,000 recordings can be made and these are stored for 2 years. There is no limit to the number of A/B tests and edits the users can make.
Pro plan
- $249 per month
The Pro plan is perfect for larger enterprises that want to track traffic on all of their sites with up to 500,000 page views per month. Up to 5,000 recordings can be made and their shelf life is 2 years. Pro plan users also receive priority support.
Custom plan
- Priced according to requirements
Crazyegg also offers a Custom plan for those who simply need more. This plan allows you to select any number of options and tools Crazyegg has on offer.
Mixpanel — Web analysis and data science
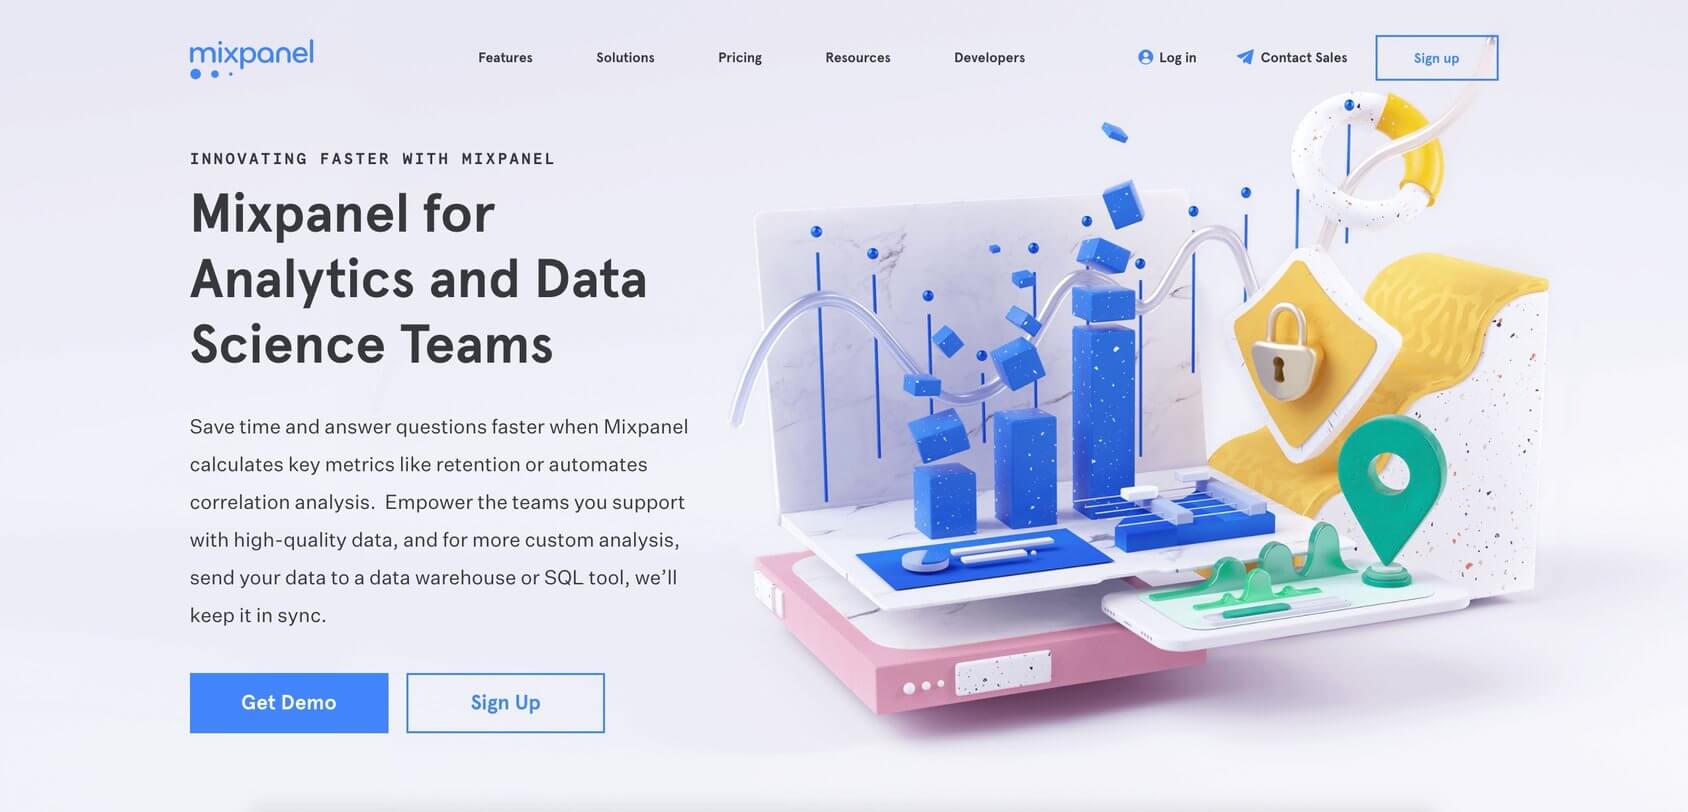
Mixpanel is a platform that measures user experience, analyzes it, and helps websites with customer retention.
Mixpanel is a very useful tool for websites that want to know how their customers interact with their site and the products sold there so that website owners can get a better understanding of the behavior of their customers, identify current trends, and ultimately base their decision according to the collected data.
Mixpanel is focused on individual users and is an event-based model that connects interaction to a particular user so that you can target them with appropriate messages to boost engagement with the site.
Apart from the mighty analytics available to users, Mixpanel allows users to see simple yet extensive reports on traffic and create cohorts, build funnels, and much more.
Key features
- Behavioral analytics — analyzing customer behavior to learn more about them and how they see your product in order to improve it and maximize conversion rates.
- Data science — data science models allow websites to predict the actions of users, identify changes, and act accordingly.
- Testing and messaging — send targeted messages and run A/B tests to specific users to encourage them to take certain actions.
- Data access in real-time — the majority of user data is available to analyze in under a minute.
- Easy integration with other platforms — Mixpanel is available for integration with 30+ platforms to get the best results.
Pricing and plans
Mixpanel offers a free plan and several paid ones, depending on what type of business you run and what your needs are.
Free plan
- Free of charge
The Free plan gives unrestricted access to all analytics for 1,000 tracked users and stores data for 90 days.
Growth plan
- Starting at $20 per month
The Growth plan offers everything included in the Free plan and more. You can track up to 25,000 users, use B2B analytics tools, store data for 12 months, and more.
Entreprise
- Starting at $1,667 per month
With the Entreprise plan, users get everything from the Growth plan plus customizable data history, unlimited data storage, security consultations, and even live chat support.
How to choose the right web analytics software
With so many web analytics software solutions out there, it is undeniably difficult to choose which one would be best for your business. No one wants to go through the process of implementation of a software tool only to realize that it is not good enough and that it does not satisfy the needs of your business. Here’s what you need to be aware of when choosing the right software tool for you.
Know your preferences and requirements
The first thing that you need to sort out is what exactly you want to track. If you have a good understanding of your products and customers, you need to determine the type of data that matches your needs.
Consider the number of features
The rule of thumb is that the best analytics software is the one with the most features. While this might be true to an extent, it is even more important to have a web analytics software tool that offers the features that you need for your project and the traffic you want to track.
You can even create a list of features you find essential, such as funnels, real-time reporting, behavioral cohorts, multiple dashboards, and others, and then look for a piece of software that offers those.
Mind the price tag
Most business owners make careful budgeting decisions, and pricey web analytics software solutions often can’t find their place on the list of planned costs. However, these tools are essential for boosting conversion rates and improving user experience.
With that in mind, you need to be fully aware of the present and future costs, so that your new software tool does not become a liability in the future. You also need to find the right balance between the price tag of the product and the features it offers.
Is the software mobile-friendly?
Plenty of web analytics software solutions are designed for desktop users only, putting companies that focus on mobile devices in a tough spot. If you are a company that relies on mobile solutions, you need to find a software tool that matches your preference.
Best of the best
Now that you have a general idea about the different web analytics software solutions and their features, you are probably wondering which one is truly the best. To help you out with that as well and narrow the list down a bit, I have selected the best free analytics software, the best one for small businesses, as well as the best one for eCommerce.
Best free web analytics tool
Everyone likes freebies, and things are no different when it comes to web analytics tools. If the tool fulfills its purpose and helps you to analyze your web traffic, there is no reason why you shouldn’t at least give it a shot. Although free tools usually don’t have all the same features you find in paid plans, there are still many things they can do for you.
Best web analytics tool for small businesses
Small web-based businesses rely heavily on their online presence, which is why proper web traffic and customer behavior analytics tools are their weapon of choice. With the right data from their users, small businesses can make the necessary changes to their products, which is often exactly what they need to transform from a small business to a large enterprise.
Best web analytics tool for eCommerce
All eCommerce store owners know the importance of analytics in planning business moves and making sure that their customers get the experience they desire, which will make them come back and buy again.
With web analytics tools, eCommerce businesses get a deep understanding of how their customers found out about the store, who or what led them there, and what ultimately enticed them to complete the purchase.
FAQs
Web analytics tools help website owners track traffic on their sites and learn more about the people who visit them. User behavior is also tracked so that businesses can collect all sorts of information, such as where on the page users are clicking, at what point they are leaving the website, and much more.
Absolutely. Analytics tools let you know the location and IP address of your visitors, how they got there, how much time they spent on the site, where they went afterward, and more.
To set up Google Analytics, you need to register a free account first, then select the website or app you want to track, choose the filters you want to apply to the data collected, and ultimately add the tracking code to your website so that you can start tracking.
With the web analytics software, you can track a wide variety of things, such as where on the page your visitors are clicking, how far they are scrolling, how long they’re staying on the website, and more.
Conclusion
Understanding customers’ behavior and needs are crucial when it comes to improving your product and website and turning occasional visitors into long-term loyal customers. Website analytics tools can help you maximize the potential of your business and learn all about the habits, expectations, and needs of your customers.
Here you will find the pick of the litter when it comes to web analytics tools as well as concise reviews of each one’s features so that you can see which best suits your needs. Whichever one you choose, it will undoubtedly give you a new perspective of your customer’s requirements and highlight any potential areas of improvement.


