Social Media Statistics for 2024: 54 Stats You Need to Know

Social media today is unrecognizable compared to the social media of the early 2000s. It’s no longer a place solely for sharing every thought that pops into your head (although that depends on who you ask). It’s now a place for truly connecting with others, shopping, keeping updated on the latest news and events, even working.
Social media is effectively the capital of the internet, and it’s becoming ever more crowded by the day.
Over the past year, social media usage has skyrocketed – not surprising considering that a vast majority of the population spent most of the time at home and online in 2020 and 2021 due to the pandemic. But just how much has the social media landscape changed in the recent months? Which platforms are the industry leaders, how have social media marketing and content creation changed? Let’s find out through some of the most intriguing social media stats of 2021.
Interesting Social Media Statistics
- Facebook remains the most popular social media platform with 2.89 billion monthly active users;
- Mark Zuckerberg’s net worth is estimated at $119.4 billion.
- TikTok’s grown from 65 million users in 2017 to over a billion in 2023;
- WeChat has over 1.25 billion monthly active users.
- Of 5.1 billion active internet users worldwide, 4.2 billion are active social media users;
- The social networking sites industry is worth $62.5 billion in 2021;
- The number of social media users among the baby boomer generation has increased by 54%;
- The majority of Twitter and Instagram users are between the ages of 25 and 34;
- Over 77 million Twitter users come from the US alone;
- Over 90% of consumers who follow a brand on social media purchase something from that brand;
- Although Instagram sees low posting volume, it has the highest engagement rates across platforms;
- Video remains the most valuable type of content on social media.
The top dogs of social media
Social media is becoming a highly competitive industry. It seems like a new platform takes the world by storm and gathers millions of users every other day.
Long gone are the days of Myspace where each person had one, maybe two accounts on social networking sites. Today, the average person has 8.4 accounts! But which platforms see the highest number of users? Who are the true top dogs of social media? Let’s find out.
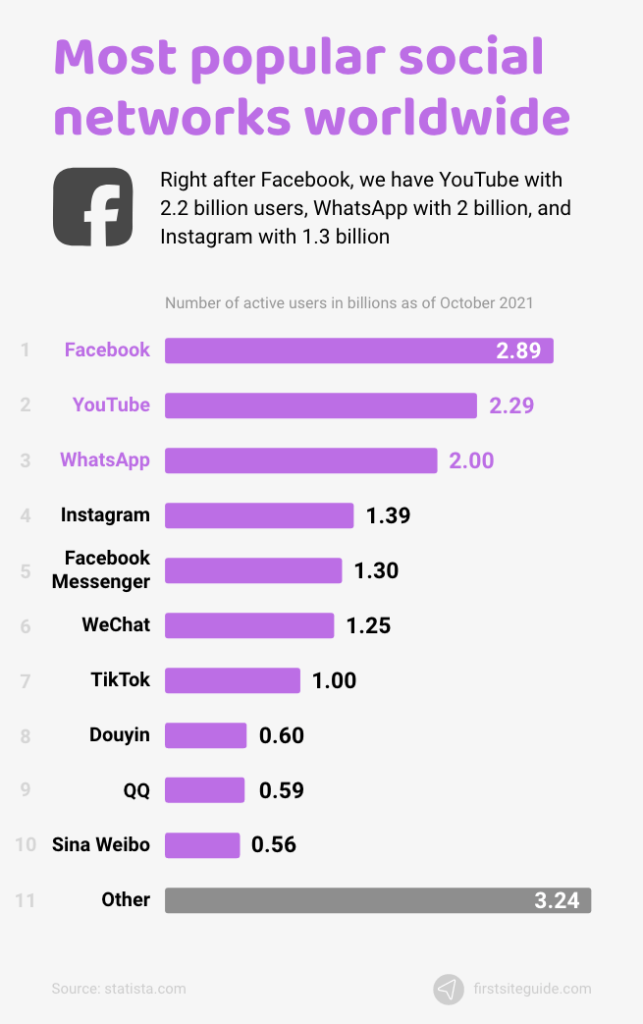
1. With 2.89 billion users, Facebook continues to outperform all competitors.
Despite the rising popularity of Snapchat, TikTok, and Twitter, Facebook remains the most popular social media platform. It boasts over 2.89 billion users, outperforming every competitor by a significant margin.
Right after Facebook, we have YouTube with 2.3 billion users, WhatsApp with 2 billion, and Instagram with 1.3 billion. Drawing quite the attention but still lagging behind are TikTok with over 1 billion users, Snapchat with 514 million, Reddit with 430 million, and Twitter with 397 million.
(Source: Statista.com)
2. 62% of the entire US population 12+ uses Facebook.
Consistent with it being the most popular platform, Facebook enjoys brand usage among 62% of the entire US population aged 12 and over – a percentage that’s been largely stable over the last three years. Following right behind are Instagram, with 43% brand usage among those 12 and over; Pinterest, with 31% brand usage; and Snapchat, with 28% brand usage.
(Source: Edisonresearch.com)
3. Q3 of 2021 sees Facebook reach 2.81 billion cumulative product users.
Facebook, Inc., or as of recently, Meta Platforms, Inc., has several core products – Facebook, Instagram, WhatsApp, and Messenger. Cumulatively, these products enjoyed 2.81 billion daily active users. That marks a significant increase compared to the same period in 2020, which saw 2.54 billion users, and 2019, which saw 2.2 billion users.
The company stated that its monthly active product users surpassed 3.58 billion Q3 of 2021.
(Source: Statista.com)
4. Engagement rates per post reach 0.09% on Facebook.
The median engagement rates by follower per post have remained largely unchanged since 2019 on Facebook. The cross-industry average stands at 0.09%, while the best-performing industries include sports teams with engagement rates of 0.18%, influencers and higher ed with 0.15% each, and hotels and resorts with 0.13%.
Somewhat surprisingly, engagement rates stand at 0.02% in the tech and software industry, 0.03% in the fashion industry, and 0.05% in health and beauty.
(Source: Sproutsocial.com)
5. TikTok breaks a billion monthly active users in Q3 of 2021.
TikTok is one of the fastest-growing apps on the market, even after India and Pakistan have banned it for “morality issues.” Launched in 2016 under the name Douyin in China, the international version known as TikTok hit the markets in 2017 and immediately started garnering attention.
In four years, the platform went from 65 million to over a billion monthly active users. With 693 million downloads in 2019 and 850 million in 2020, it’s in the top 10 most downloaded apps of the 2010s.
(Source: Businessofapps.com)
6. Twitter to get 340 million users by 2024.
Twitter has been steadily growing over the past few years. When it went public in 2013, it enjoyed around 200 million fans worldwide, and currently, it boasts over 320 million monthly active users. That number should rise to over 340 million by 2024.
(Source: Statista.com)
7. WeChat broke a billion users in 2018 and reaches over 1.25 billion people in 2021.
WeChat is among the leading social networking sites around the globe, sixth in terms of active users. Released in 2011 under the name Weixin, it rebranded to WeChat in 2012 and quickly started accumulating global audiences. The platform went from 2.8 million users in 2011 to 1.25 billion in 2021.
WeChat has evolved from a simple communications service to a full-blown social media platform with various features, including voice and text messaging, gaming, making payments, and publishing Moments (photos, videos, and status updates).
(Source: Statista.com)
8. Cristiano Ronaldo has the most popular Instagram account with over 315 million followers.
Although Kylie Jenner, with her 249.65 million followers, is often regarded as the most popular Instagrammer, she’s not even in the top three. As of July 2021, the top Instagram accounts include Cristiano Ronaldo with his 315.75 million followers, The Rock (aka Dwayne Johnson) with 254.76 million followers, and Ariana Grande with 252.84 million followers.
Of course, none outperform Instagram’s own account with 439 million followers.
(Source: Statista.com)
9. Barack Obama has the most popular Twitter account with over 129 million followers.
Despite all the celebrities and businesses that use Twitter daily, it’s the former president of the US that enjoys the greatest following. Obama has 129.78 million followers on the platform, and following right behind him is Justin Bieber, with 114.04 million followers.
Other renowned accounts include Katy Perry with 109.52 million followers, Rihanna with 102.22 million, Cristiano Ronaldo with 91.39 million, and Taylor Swift with 88.51 million.
(Source: Statista.com)
Social media market size
The social media market has been growing exponentially, even before the pandemic. However, since the start of 2020, the top platforms have undergone quite a growth spurt. There are more users across age groups, and there’s a broader adoption across countries. Social networking sites are breaking profit records, and even offshoot industries like social media management and social media analytics are seeing exciting activity.
Let’s dive deeper into the social media market and see how it fared in 2021.
10. 65% of the total global population is online.
Over 5.1 billion people are internet users, accounting for 65% of the entire global population as of 2021. Of the 4.66 billion, 4.32 billion are mobile internet users, while 4.2 billion are active social media users.
Internet penetration is the highest in Northern Europe, where it sits at 96%. However, most internet users come from Asia – 2.5 billion. The only exception is North Korea, which has virtually no internet penetration.
(Source: Internetworldstats.com)
11. China is projected to have over 1.27 billion social network users by 2026.
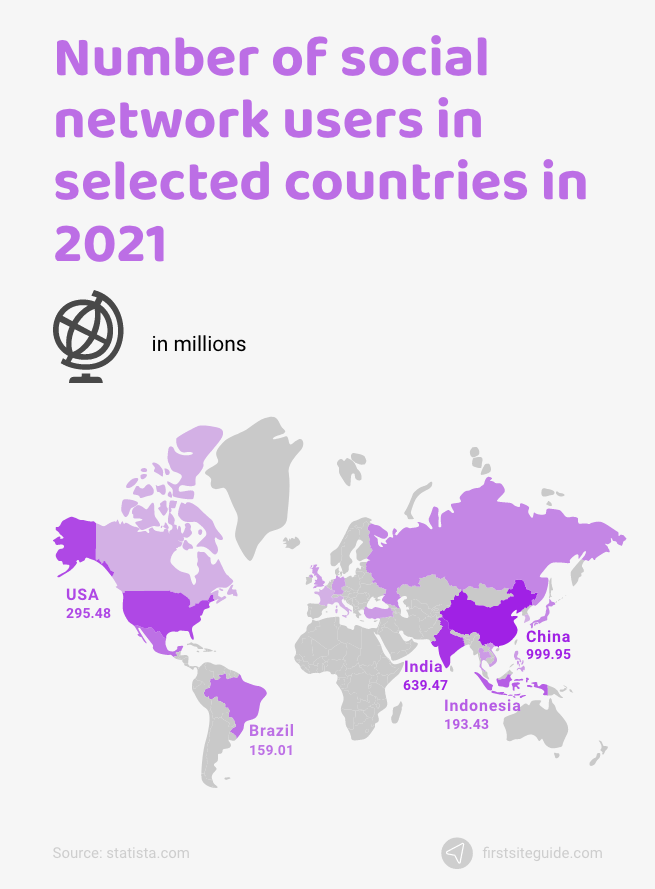
In 2021, mainland China boasts the highest number of social media users, sitting at 999 million. The number is expected to go up to 1.27 billion by the end of 2026. India holds second place, with its 693 million social network users (projected 1.11 billion by 2026), and the US holds third place, with 295 million (323.07 million by 2026).
Behind the US, we have Indonesia, Brazil, and Russia, all with over 100 million users.
(Source: Statista.com)
12. Global social media platforms to reach $939.67 billion by 2026.
In 2019, the global social media market was valued at $192 billion. Over the course of the following five years, experts estimate that the market will continue growing at a compound annual growth rate of 25.38%, reaching the value of $939.67 billion by the end of 2026.
(Source: Researchandmarkets.com)
13. Social media analytics market to reach $9.3 billion by 2026.
As the social media industry grows, so do all of its accompanying sectors. Social media analytics services are rising in demand. The entire industry is expected to grow at a CAGR of 24% during the next five years, going from the market value of $3.2 billion in 2021 to $9.3 billion by 2026.
Although the social media analytics market is growing fast in North America, the fastest-growing region is expected to be the Asia Pacific.
(Source: Marketsandmarkets.com)
14. The social media management market to grow at a CAGR of 23.6% by 2026.
With more social media users than ever before and significant advancements in social media analytics, the need for social media management has been on the rise lately. Some of the drivers of this trend include the need for a better customer experience and increased user engagement.
Therefore, the social media market is set to grow from $14.4 billion in 2021 to $41.6 billion in 2026, experiencing a CAGR of 23.6% over that period.
(Source: Reportlinker.com)
15. The market size of social networking sites in the US reaches $62.5 billion.
Less than a decade ago, the social networking sites in the US were valued at around 10 billion (measured by their revenue). In 2021, that number reached an astonishing $62.5 billion. The social networking sites industry has grown much faster than the overall US economy, presenting unique opportunities despite the difficulties imposed by the pandemic.
(Source: Ibisworld.com)
16. The market size growth of social networking sites reaches 17.2%.
Growing at a rate of 17.2% in 2021, the social networking sites market has increased faster than the overall tech sector. Between 2016 and 2021, the social networking sites market has undergone a growth spurt of 23.9%, a trend that’s likely to continue over the following years.
(Source: Ibisworld.com)
Social media demographics
Social media platforms are becoming ever-more diverse. Even younger platforms like Snapchat and TikTok are seeing an increase in users across all age groups. From Zoomers to Millenials, Gen Xers, and Boomers, social networking platforms are attracting all audiences worldwide.
Let’s take a look at some interesting social media usage trends across generations, cultures, and sexes.
17. Social media use among Boomers has increased by 54% in 2021.
Despite what memes and media might suggest about the irreconcilable differences between younger and older generations, they do have one thing in common, and that’s that all consumers across age groups have grown more dependent on social media.
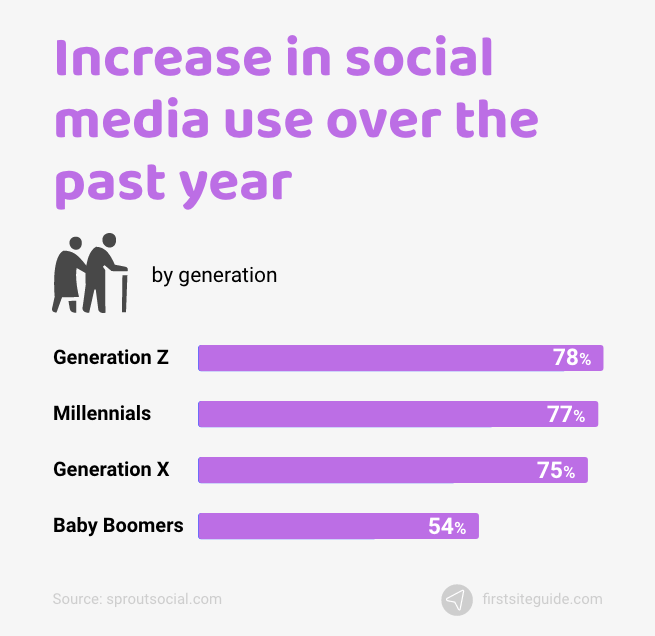
In the past year alone, social media use among Gen Z, aka Zoomers (born between 1997 and 2012), has increased by no less than 78%. Millennials (born between 1981 and 1996) are following close behind, with social media use increasing by 77%.
What’s surprising is that we see similar trends among older generations, as well. Social media use among Gen X (born between 1965 and 1980) has increased by 75%, and among Boomers (born between 1955 and 1964) by 54%.
(Source: Sproutsocial.com)
18. Facebook is the most popular social media brand in the US among those age 35 and older.
Facebook remains the most popular platform among older Millennials, Gen Xers, and Boomers. Over 60% of social media users in the age range of 35 to 54 use Facebook the most often. 10% of them prefer Instagram, while 7% see Pinterest as their go-to platform.
Among those 55+, 70% use Facebook, 6% Whatsapp, and 4% Twitter.
Younger generations are slightly more evenly divided across social media brands. 33% of those between 12 and 34 years old use Instagram the most often, 21% Facebook, 15% Snapchat, and 14% TikTok.
(Source: Edisonresearch.com)
19. The biggest demographic group on Facebook is men between 25 and 34 years old.
In virtually all age categories, it’s men who dominate Facebook. Over 18.8% of all Facebook users are men between the ages of 25 and 34, compared to only 12.5% of women in the same age range. The second most represented category are men between 18 and 24, accounting for 13.8% of all users. Women in the same age range represent only 9.4% of all Facebook users.
(Source: Statista.com)
20. 32.1% of all Instagram users are between 25 and 34.
It’s not surprising that younger generations dominate the world of Instagram. Over 32.1% of all Instagrammers are between 25 and 34 years old. Those between 18 and 24 represent 29.9%, while those between 35 and 44 represent 16.3% of all Instagram users. Users 65+ represent only 2.3% of all Instagrammers.
All in all, over two-thirds of all Instagrammers are younger than 34.
(Source: Statista.com)
21. Social network penetration in the United Arab Emirates goes up to 99%.
As of January 2021, over 99% of all internet users from the UAE are on social media, marking record social media penetration. With social media penetration of 89.3%, South Korea takes second place, while Taiwan comes in third, with 88.1%.
The USA isn’t even in the top 30 countries with the highest social network penetration, outperformed by countries such as Canada, the UK, Mexico, and Vietnam, to name but a few. Of all the internet users in the US, only 72.3% are active on social media.
(Source: Statista.com)
22. 349 million Facebook users come from India.
Although Brazil, Indonesia, and the United States all have record numbers of Facebook users, 127 million, 142 million, and 194 million, respectively, India takes the cake. Over 349 million Facebook users come from India alone, making it the leading country based on audience size on Facebook.
Other notable countries that haven’t yet broken the 100 million mark (but are about to) include Mexico with its 98 million Facebook users, the Philippines with 88 million, and Vietnam with 71 million.
(Source: Statista.com)
23. Over 77 million Twitter users come from the US alone.
Although Twitter doesn’t enjoy nearly as many users as Facebook, it still remains one of the top social networking platforms, especially in the US, where it has 77.7 million users.
Japan follows close behind on Twitter, with 58.2 million users, and India is slightly lagging behind with 24.4 million.
(Source: Statista.com)
24. 38.5% of all Twitter users are between the ages of 25 and 34.
Both Twitter and Instagram are the most popular among those between the ages of 25 and 34. Over a third of all Twitter users, or 38.5%, to be exact, fall within this age bracket. The second-largest group is those between 35 and 49, representing 20.7% of all Twitter users, while those between 18 and 24 and 50+ share the third spot with 17.1% worldwide users each. The least represented age group on Twitter are teens, with only 6.6% of all users being between 13 and 17.
(Source: Statista.com)
25. Only 31.9% of all Twitter users are female.
Like Facebook, Twitter is mostly dominated by male users, although the gender gap is much more apparent on the latter platform. Only 31.9% of all Twitter users as of January 2021 are female, while 68.1% are male.
(Source: Statista.com)
The rising annual revenue from social media marketing
Considering that the most popular social media platforms are free for all, the largest sites get most of their income from advertising. Social media marketing is a quickly growing industry that presents unique opportunities to all those who are willing to take them.
Advertising on social media can increase any business’s reach, engagements, and ultimately, return on investment.
Take a look at the key social media marketing stats to learn exactly why it’s such a growing trend.
26. Over 53% of consumers follow brands on social media to learn more about the brand’s offer.
Consumers have an array of reasons for liking and following a brand on social media. However, over 53% of them do so to learn about new products and services offered by the brand. 52% use social media to stay updated on relevant company news, while 38% just want to have some entertainment.
Other reasons for following a brand on socials are reading about others’ brand experiences (35%) and simply getting inspired (34%).
(Source: Sproutsocial.com)
27. 91% of customers who follow a brand on socials visit the brand’s site/app.
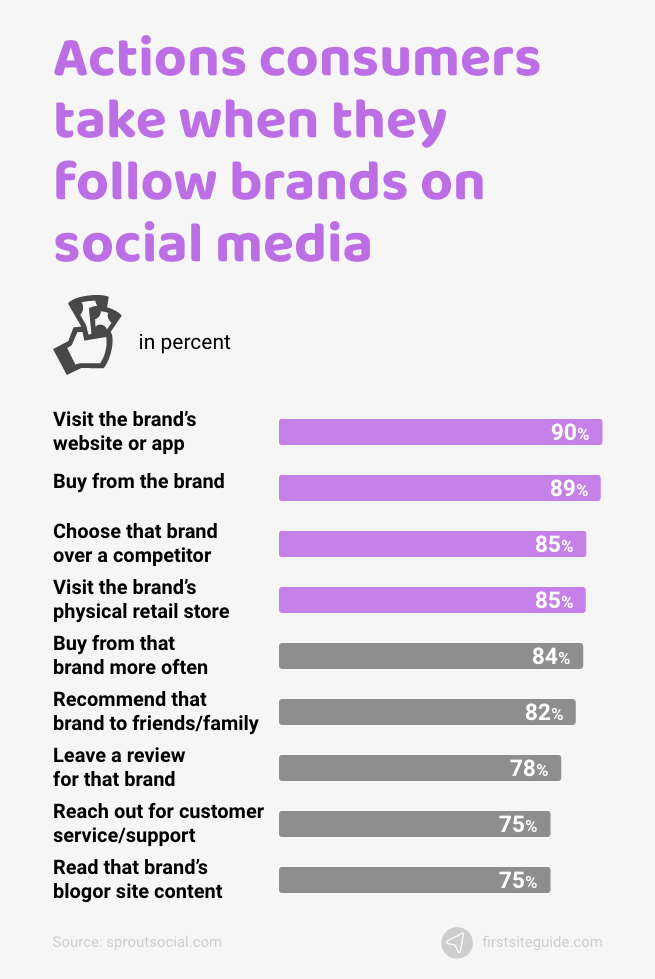
Most consumers who follow a brand on social media take some form of action when doing so. Over 91% will visit the brand’s site or app after giving them a follow on socials. 90% will make a purchase, and 86% will choose the said brand over any other competitor.
Additionally, 86% will visit the physical location of the business, 85% will make repeat purchases, 83% will recommend the brand to friends and family.
(Source: Sproutsocial.com)
28. 46% of marketers strictly use social data as a marketing resource.
Consumer data garnered from social media is a valuable resource with great potential. Still, over 46% of marketers use it solely as a marketing resource. 47% use it for multi-team strategizing, while only 8% use it as organization-wide business intelligence.
(Source: Statista.com)
29. 93% of social media marketers use Facebook for business promotion.
Although there are dozens of social media platforms that marketers could use to reach wider audiences, a vast majority, aka 93% of them, use Facebook. Another Facebook, Inc. (Meta Platforms, Inc.) product follows close behind – Instagram, used by 78% of marketers.
Other notable platforms for social media marketers are LinkedIn, YouTube, and Twitter, but none are used nearly as often.
(Source: Statista.com)
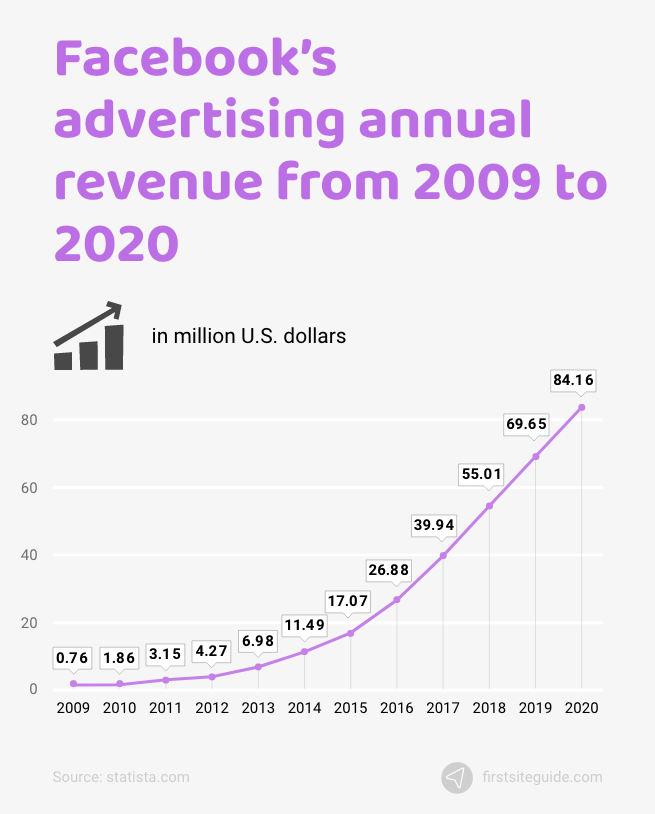
30. Facebook’s annual advertising revenue in 2020 reached $82.1 billion.
Facebook’s advertising revenue has been steadily rising over the last decade. In its early years, Facebook earned around 764 million in advertising revenue only. By 2015, that number rose to over $17 billion, only to go up to an astonishing $82.1 billion in 2020 – an increase of 21% from the year prior.
(Source: Statista.com)
31. Mobile social media ad spending in the US is expected to go up to $71.4 billion by 2025.
As social platforms exceedingly go mobile, so do the ads. Businesses in the US are already making heavy investments into social media advertising as a whole, but many are now turning their eyes solely to mobile social media marketing.
In 2020, mobile social media ad spending in the US was valued at around $42.2 billion. By 2025, that number is expected to rise to an astounding $71.4 billion.
(Source: Statista.com)
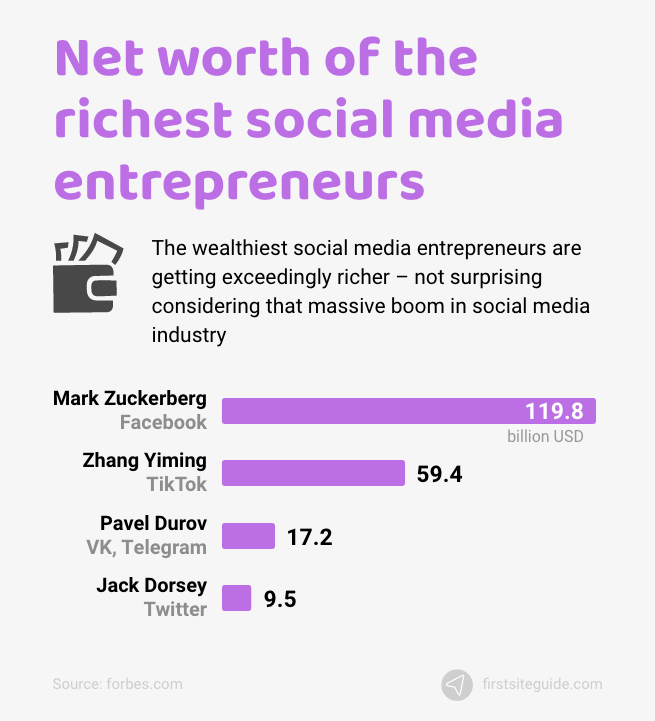
32. Mark Zuckerberg’s net worth is estimated at $119.4 billion.
The wealthiest social media entrepreneurs are getting exceedingly richer – not surprising considering that massive boom in social networking.
Facebook, Inc.’s (now Meta Platform, Inc.’s) co-founder Mark Zuckerberg has an estimated net worth of $119.4 billion.
The creator of TikTok, Zhang Yiming, holds the second place as the richest social media entrepreneur but still has less than half of Zuckerberg’s fortune, with a net worth of over $59.4 billion.
Pavel Durov, the co-founder of Telegram and founder of the Russian social media platform VK, has a net worth of $17.2 billion, while Jack Dorsey, co-founder, and CEO of Twitter, has $9.7 billion.
(Source: Forbes.com, Forbes.com, Forbes.com, Forbes.com )
33. The average cost-per-click (CPC) on Facebook stands at $1.04.
Facebook CPC can refer to any relevant clicks – clicks to react to a post, view an image, watch a video, and more. However, for advertisers, there’s usually only one click and one CPC metric that matters – link clicks.
On Facebook, the average link CPC stands at $1.04 as of October 2021. Higher CPC can easily be handled by better targeting the audiences, improving ad relevance, and optimizing ad content for audiences based on their current stage in the sales funnel.
(Source: Revealbot.com)
34. The average cost-per-click (CPC) on Instagram stands at $1.56.
Although both Facebook and Instagram belong to the same company, the average CPC on Instagram is slightly higher, standing at $1.56 as of October 2021.
(Source: Revealbot.com)
35. The average ad click-through rate on Facebook stands at 0.9%.
The cross-industry ad click-through rate on Facebook is 0.9%, significantly lower than the 2% click-through rate on AdWords.
Some industries on Facebook perform significantly better than others, with the leading CTRs belonging to legal ads (1.61%), retail (1.59%), and apparel (1.24%).
Sectors with lower-than-average CTRs on Facebook include employment and job training (0.47%), finance and insurance (0.56%), and customer services (0.62%).
(Source: Wordstream.com)
36. Facebook ads conversion rates stand around 9.21%.
While CTRs on Facebook are slightly lower than expected, ad conversions (CVRs) are going through the roof. The cross-industry average is 9.21%, but some industries fare much better than that.
The fitness sectors enjoy Facebook ad conversion rates of 14.29%, followed closely behind by education with a 13.58% CVR. Even though the employment and training sector has the worst CTRs on Facebook, it’s among the top performers in terms of CVRs – 11.73%.
(Source: Wordstream.com)
37. Advertisers can expect an average cost per action (CPA) on Facebook to be $18.68.
Depending on the industry, CPA on Facebook can prove to be quite an investment. The highest CPA is recorded in the tech sector, with an average CPA of $55.21. Home improvement, auto, and finance, and insurance all have high CPAs, as well – $44.66, $43.84, and $41.43, respectively.
We see the lowest cost per action in education ($7.85), apparel ($10.98), and healthcare ($12.31).
(Source: Wordstream.com)
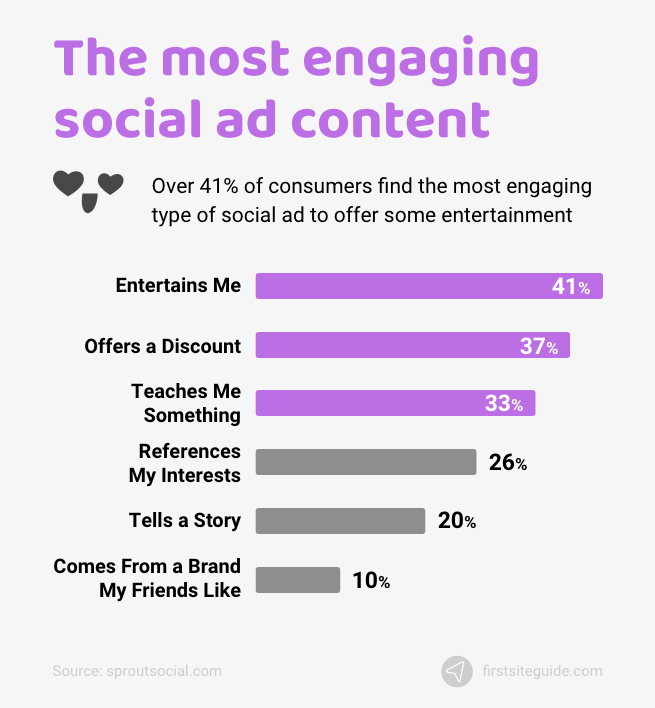
38. 41% of consumers find the most engaging social media ad content to be entertaining.
Creating engaging social media ads can be a challenge, but all businesses have to do is listen to their audiences.
Over 41% of consumers find the most engaging type of social ad to offer some entertainment. 37% of them will engage with an ad if it offers a discount, and 33% will engage if the ad is educational.
Other drivers of engagement include referencing the customers’ interest (26%), telling a story (20%), and coming from a brand enjoyed by friends and family (10%).
(Source: Sproutsocial.com)
39. Video ad spending in the US is valued at $34.3 billion in 2020.
As video is becoming the most sought-after type of content, social media advertisers in the US are starting to invest more heavily in digital video ads on platforms like Facebook and Instagram.
The average digital ad spending across industries in the US was valued at $34.3 billion in 2020. The figure is expected to rise to $63.3 billion by 2025.
(Source: Statista.com)
40. The US’s total digital ad spending to reach $56.68 billion by the end of 2021.
The US is by far the heaviest spender on digital ads. By the end of 2021, the total digital ad spending in the US is set to go over $56.68 billion, and China is following right behind, spending $45.13 billion by the end of the year.
(Source: Statista.com)
41. Only 12% of customers leave product/service feedback on the company’s site.
Although it seems like the most convenient option, a company site is one of the least popular places for leaving customer feedback, with only 12% of all consumers using it. More frequently, consumers prefer using social media, with over 31% of them leaving product and service feedback on platforms like Facebook and Twitter.
18% of consumers will leave feedback via email, 16% via a review site, 11% via the customer service number, and 8% via brand surveys.
Not surprisingly, leaving feedback in-store is the least popular method, with only 3% of customers using it.
(Source: Sproutsocial.com)
42. 47% of consumers believe that strong customer service makes a brand the best-in-class on social media.
Over 48% of marketers believe that engaging their audiences is what makes their brand the top-performer on social media, but 48% of marketers seem to be wrong. Consumers are much more practical, with 47% of them considering good customer service as the market of a best-in-class brand on social media.
Engaging audiences (46%), offering transparency (44%), having a distinct personality (33%), telling a compelling story (28%), and setting trends (18%) are all second to excellent customer service on social media.
(Source: Sproutsocial.com)
43. Social media has created a fiercer competition for 93% of marketers.
Although social media allows brands to connect with their audiences easily, it also creates a much stronger competition. Brands now have to take on not only the competitors in their close proximity but all global companies within their niche. Over 93% of marketers state that social media has significantly accelerated competition.
(Source: Sproutsocial.com)
44. 60% of consumers want brands to use Facebook more.
Although 83% of all brands have a Facebook presence, over 60% of consumers want companies to use more of this platform. Other platforms in high consumer demand include Instagram (with 48% wanting companies to use more of it), YouTube (41%), Twitter (30%), and LinkedIn (17%).
(Source: Sproutsocial.com)
45. The number 1 reason marketers use social data is to understand the competitor’s customer loyalty.
Social data gives plenty of valuable insights, but marketers mainly use it for understanding their competitors. They rely on social data to learn more about:
- The competitor’s customer loyalty;
- Quality of the competitor’s products and services;
- How they can distinguish themselves from the competitors;
- The competitor’s customer service;
- The competitor’s percentage of media spending;
- The competitor’s strategy.
(Source: Sproutsocial.com)
46. Marketers use social data to learn how customers interact with products/services.
Social data offers unique customer insights that can prove to be invaluable to any brand. Listed by the importance, the following are the main reasons why marketers use social data:
- To learn how customers interact with products/services;
- To gauge customer dislikes about the brand;
- To assess what customers find appealing about the brand;
- To assess future customer expectations;
- To learn about customer trends;
- To learn more about their customers;
- To find out the type of content best suited to the customers.
(Source: Sproutsocial.com)
Social media content
The type of content brands post to social media has an immense effect on consumers’ perception of the brand. However, what matters more than the type of content is its quality.
Learn more about how social media content can shape consumer-brand interactions.
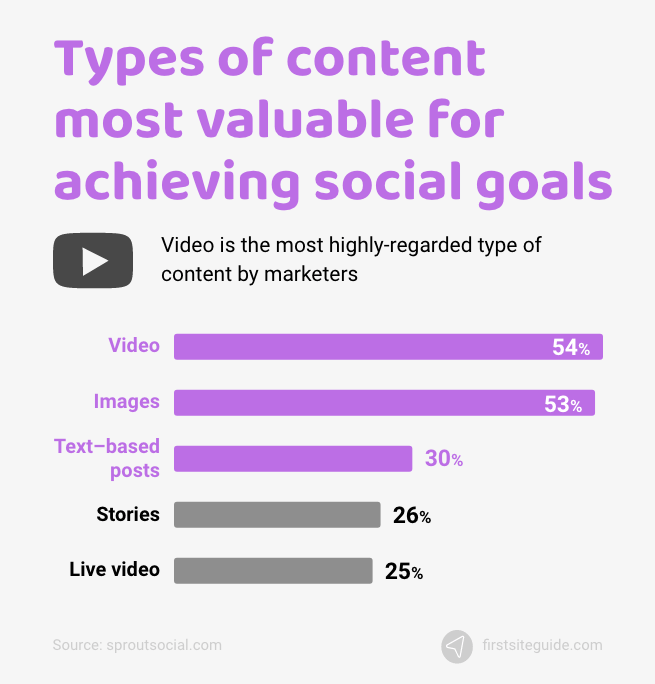
47. 54% of marketers see video as an effective tool for achieving social media goals.
Video is the most highly-regarded type of content by marketers, with over 54% of them agreeing that it’s effective at helping them achieve social media goals. However, only 25% state that live video does the same.
On top of that, 53% use images for achieving their goals, 30% use text-based content, and 26% use stories.
(Source: Sproutsocial.com)
48. 61% of all content brands post on Facebook is image-based.
Brands largely prefer to use images on Facebook, with 61% of the cross-industry content types being image-based. Link posts account for 21% of all published content, videos account for 14%, and plain text for just 4%.
On Instagram, brands rely mostly on single-image posts, accounting for 75% of the total published content. Image carousels are present in 12% of all content, single video posts in 11%, and video carousels in just 1%.
Twitter is the most versatile, with 47% single-image posts, 26% link posts, 16% plain text, 5% video, 3% multi-image, 2% places, and 1% animated GIF posts.
(Source: Sproutsocial.com)
49. Only 14% of brand Facebook posts are video-based.
Despite the fact that 54% of marketers believe in the value of video posts for achieving their goals, video content accounts for only 14% of all brand posts on Facebook.
The numbers are even lower on Instagram and Twitter, with just 11% of all content published on the former and 5% on the latter being video-based.
(Source: Sproutsocial.com)
50. Facebook influencers enjoy almost 0.20% engagement rates per post by follower.
Although many marketers spend hours analyzing the best posting frequency on Facebook, data suggests that there’s no universal rule for how often to publish content to increase engagement. Influencers on Facebook who publish new content infrequently enjoy largely the same engagement rates as sports teams with over 15 weekly posts – between 0.15% and 0.20%.
On the other hand, brands in the health and beauty industry that post just as often as influencers see only about a 0.03% engagement rate by followers.
(Source: Rivaliq.com)
51. Higher ed sees engagement rates of over 3% per post by follower on Instagram.
Instagram has proven time and time again that it’s the best platform for increasing engagement rates with a low posting volume.
Higher ed is the best-performer on Instagram, with engagement rates of over 3%/post by follower and approximately three posts per week. Sports teams come in at close second, enjoying slightly less than 2% engagement rates on their ten average posts per week.
(Source: Rivaliq.com)
52. Higher ed on Twitter sees engagement rates of 0.09%/post by follower.
Despite posting more frequently on Twitter than on Instagram, higher ed doesn’t disappoint on Twitter, either, with 0.09% engagement per post by the follower. The food and beverage industry takes second place, with posting just a couple of times per week and over 0.07% engagement.
(Source: Rivaliq.com)
53. Apple’s #ShotOniPhone campaign is the most successful campaign of 2021.
2021 saw several excellent social media marketing campaigns, with the best ones including Apple’s #ShotOniPhone, launched all the way back in 2015, Anheuser-Busch’s #LetsGrabABeer, McDonald’s Saweetie Meal, YouTube & BTS’s: Permission to Dance, Dove’s Self-Esteem Project, and American Eagle & Snapchat’s: Back-to-School.
(Source: Sproutsocial.com)
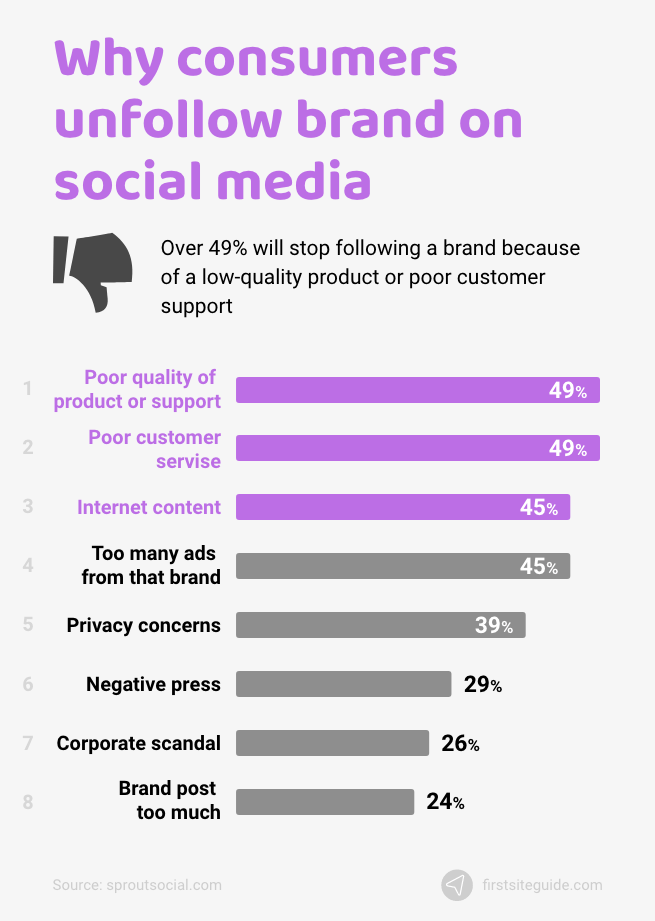
54. 49% of consumers unfollow a brand due to low-quality products or support.
Social media can be a gold mine for brands looking to connect with their audiences. However, not every consumer will stay by a brand on social media. Over 49% will stop following a brand because of a low-quality product or poor customer support. 45% will unfollow due to irrelevant content or too many ads, 39% due to privacy concerns, and 29% due to negative press.
(Source: Sproutsocial.com)
Conclusion
Social media has opened a world of possibilities for brands, marketers, and consumers alike. The stats mentioned in this article are just the tip of the iceberg, giving just a glimpse into the power of social networks. Still, they’re more than enough to point you in the right direction and help you reach your social media potential.

Great information filled with stats! Thank you!!
Thanks, Jill!