
The digital landscape is continuously growing and evolving. There are many interesting facts about the internet, internet statistics, and ways to use the internet more than you can imagine.
To help you comprehend the size, impact, and purpose of the internet (and World Wide Web) as a whole, we decided to supply you with some of the most notable information that will provide you with some perspective on the internet world as a whole.
Below, you’ll see the ultimate list of 108 essential internet statistics and facts in 10 categories to help you develop a complete perspective on this fantastic digital world.
- There are over 5.47 billion active internet users.
- As of February 2022, China has over 1 billion active users.
- There are more than 1.98 billion websites online.
- 4.32 billion people use their mobile devices to go online.
- There are 198.4 million active websites on the web.
- Around 7 million blog posts get published per day.
- There are 4.2 billion active social media users in 2021.
- 47% of internet users globally use an ad-blocker today.
- Cybercrime costs $3.5 billion for US businesses in 2019.
- Twenty-six smart objects are located near every human on earth.
- As of 2021, more than 500 hours of video are uploaded to YouTube every minute.
General facts about the Internet
The internet is the next step in the evolution of human knowledge. The internet is the modern-day library of Alexandria, but with far more information.
Internet users demographics
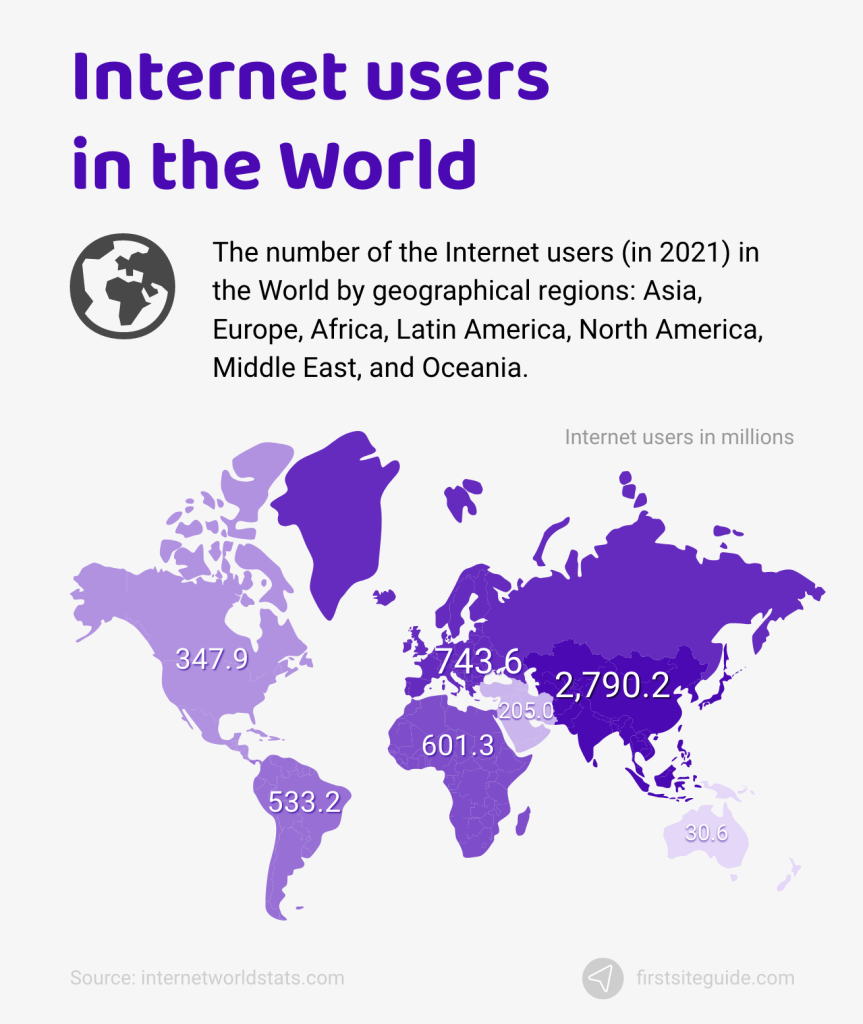
The internet has become widespread across the globe as one of the most iconic technological achievements. Let’s look at the graph below and see how widespread the internet actually is, whether there are any continents that are entirely covered with the internet, and which countries don’t have it.
(Source: Internet World Stats)
Below, we’ll list some of the most popular general internet stats to pique your interest and answer questions such as how many people in the world have the internet, how many websites are on the internet, how much people blog daily, and how many countries have internet access.
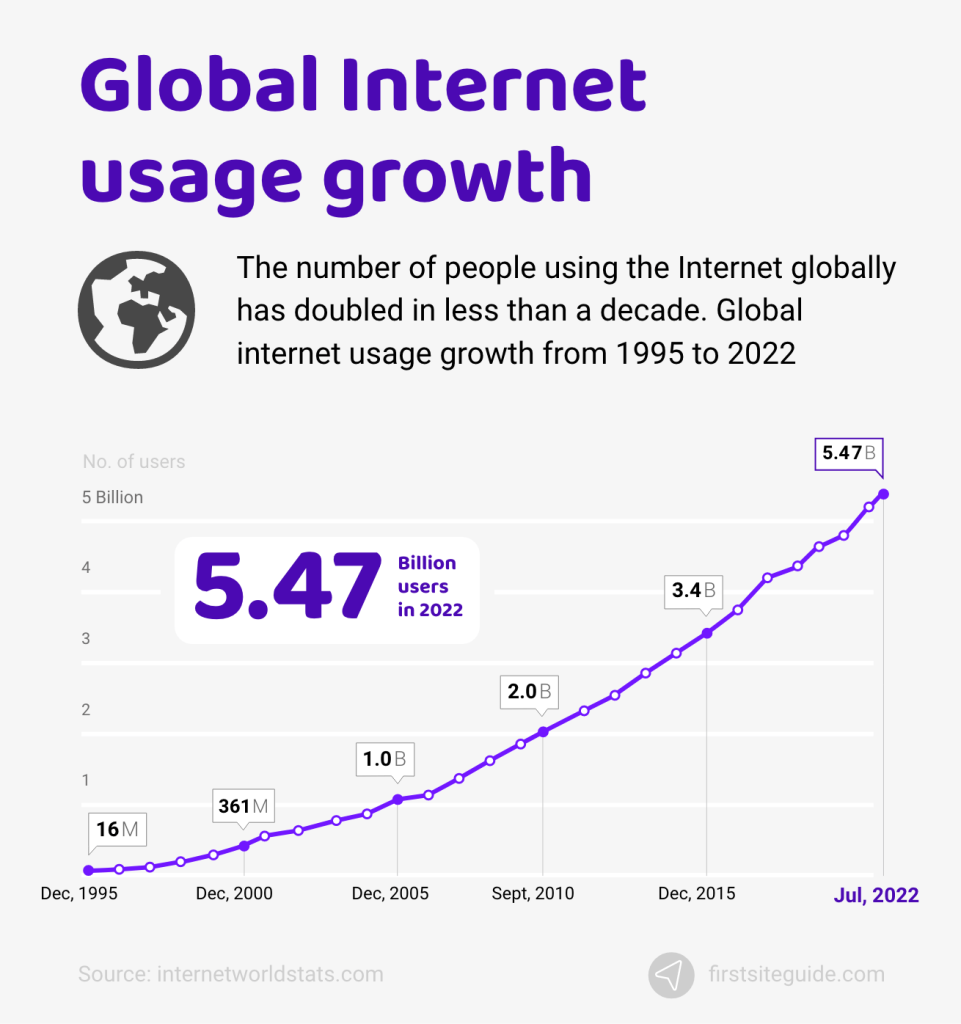
1. 5.47 billion people use the internet daily.
As of June 30, 2022, internet statistics show that there are over 5.47 billion active internet users across the world. If you are wondering how many countries have internet access, this number increases by the day, but there are still over 2.7 billion people with no internet access.
The global population in 2022 is supposed to reach 7.9 billion people. There are over 5.47 billion unique internet users, so they account for approximately 66% of the entire population.
(Source: Internet World Stats)
2. The average growth rate of internet users is 8.2% per year.
The number of internet users increases at an average rate of 8.2% a year. Compared to this, the global population increases at an average rate of just 1.05% annually.
After the radio was invented, it took 38 years to reach 50 million users. It took 75 years for the telephone to do the same. However, the internet around the world has managed to reach 50 million users in just four years.
(Source: Datareportal)
3. More than 25% of websites are in English.
The most popular language by far on the internet is English. 25.9% of the internet is in English, 19.4% is in Chinese, and 8% is in Spanish.
(Source: Statista)
4. Asia has the largest number of internet users with over 2.8 billion.
To answer the question of how many countries have internet access, we’ll start with regions. Internet world stats show that Asia is the continent with the highest number of internet users in the world, over 2.8 billion. Europe takes second place with less than half of this number, boasting just under 700 million internet users.
Unsurprisingly, as one of the most populous countries globally, China also boasts the highest number of internet users. As of February 2022, China has over 1 billion active users. It’s followed by India and 658 million users, while the USA takes third place with 307 million users.
(Source: Statista)
5. Europe is the 2nd most popular region by internet users, with 705 million internet users.
Europe has around 705 million internet users, which places it in the second spot of regions according to the global internet population. Asia comes in first with over 2 billion internet users.
(Source: Statista)
6. 98-99% of people have the internet in Denmark, Iceland, the UAE, Kuwait, and Qatar.
As of January 2021, Denmark, Iceland, the UAE, Kuwait, and Qatar have the highest internet penetration rate of any country in the world. Between 98% and 99% of the population of these countries has internet access.
As might be expected, North Korea ranks last for the number of internet users. According to a survey, the internet penetration rate is 0% here. Next to last is Eritrea, with 8% internet penetration, closely followed by South Sudan (8.3% internet penetration).
(Source: Statista)
7. 32% of Internet users worldwide are 25 to 34 years old.
As of December 2019, studies have concluded that over a third of internet users are 25-34 years old. They’re closely followed by the 35-44 age demographic, which makes up 19% of the global internet traffic statistics for users.
(Source: Statista)
8. The Chrome web browser is used by 65.9% of internet users worldwide.
As of August 2020, Chrome takes up over 65% of the global browser space. It’s followed by Safari, which accounts for 16.82% of all internet users in the world, and Firefox in third place with 4.09%.
(Source: Statcounter)
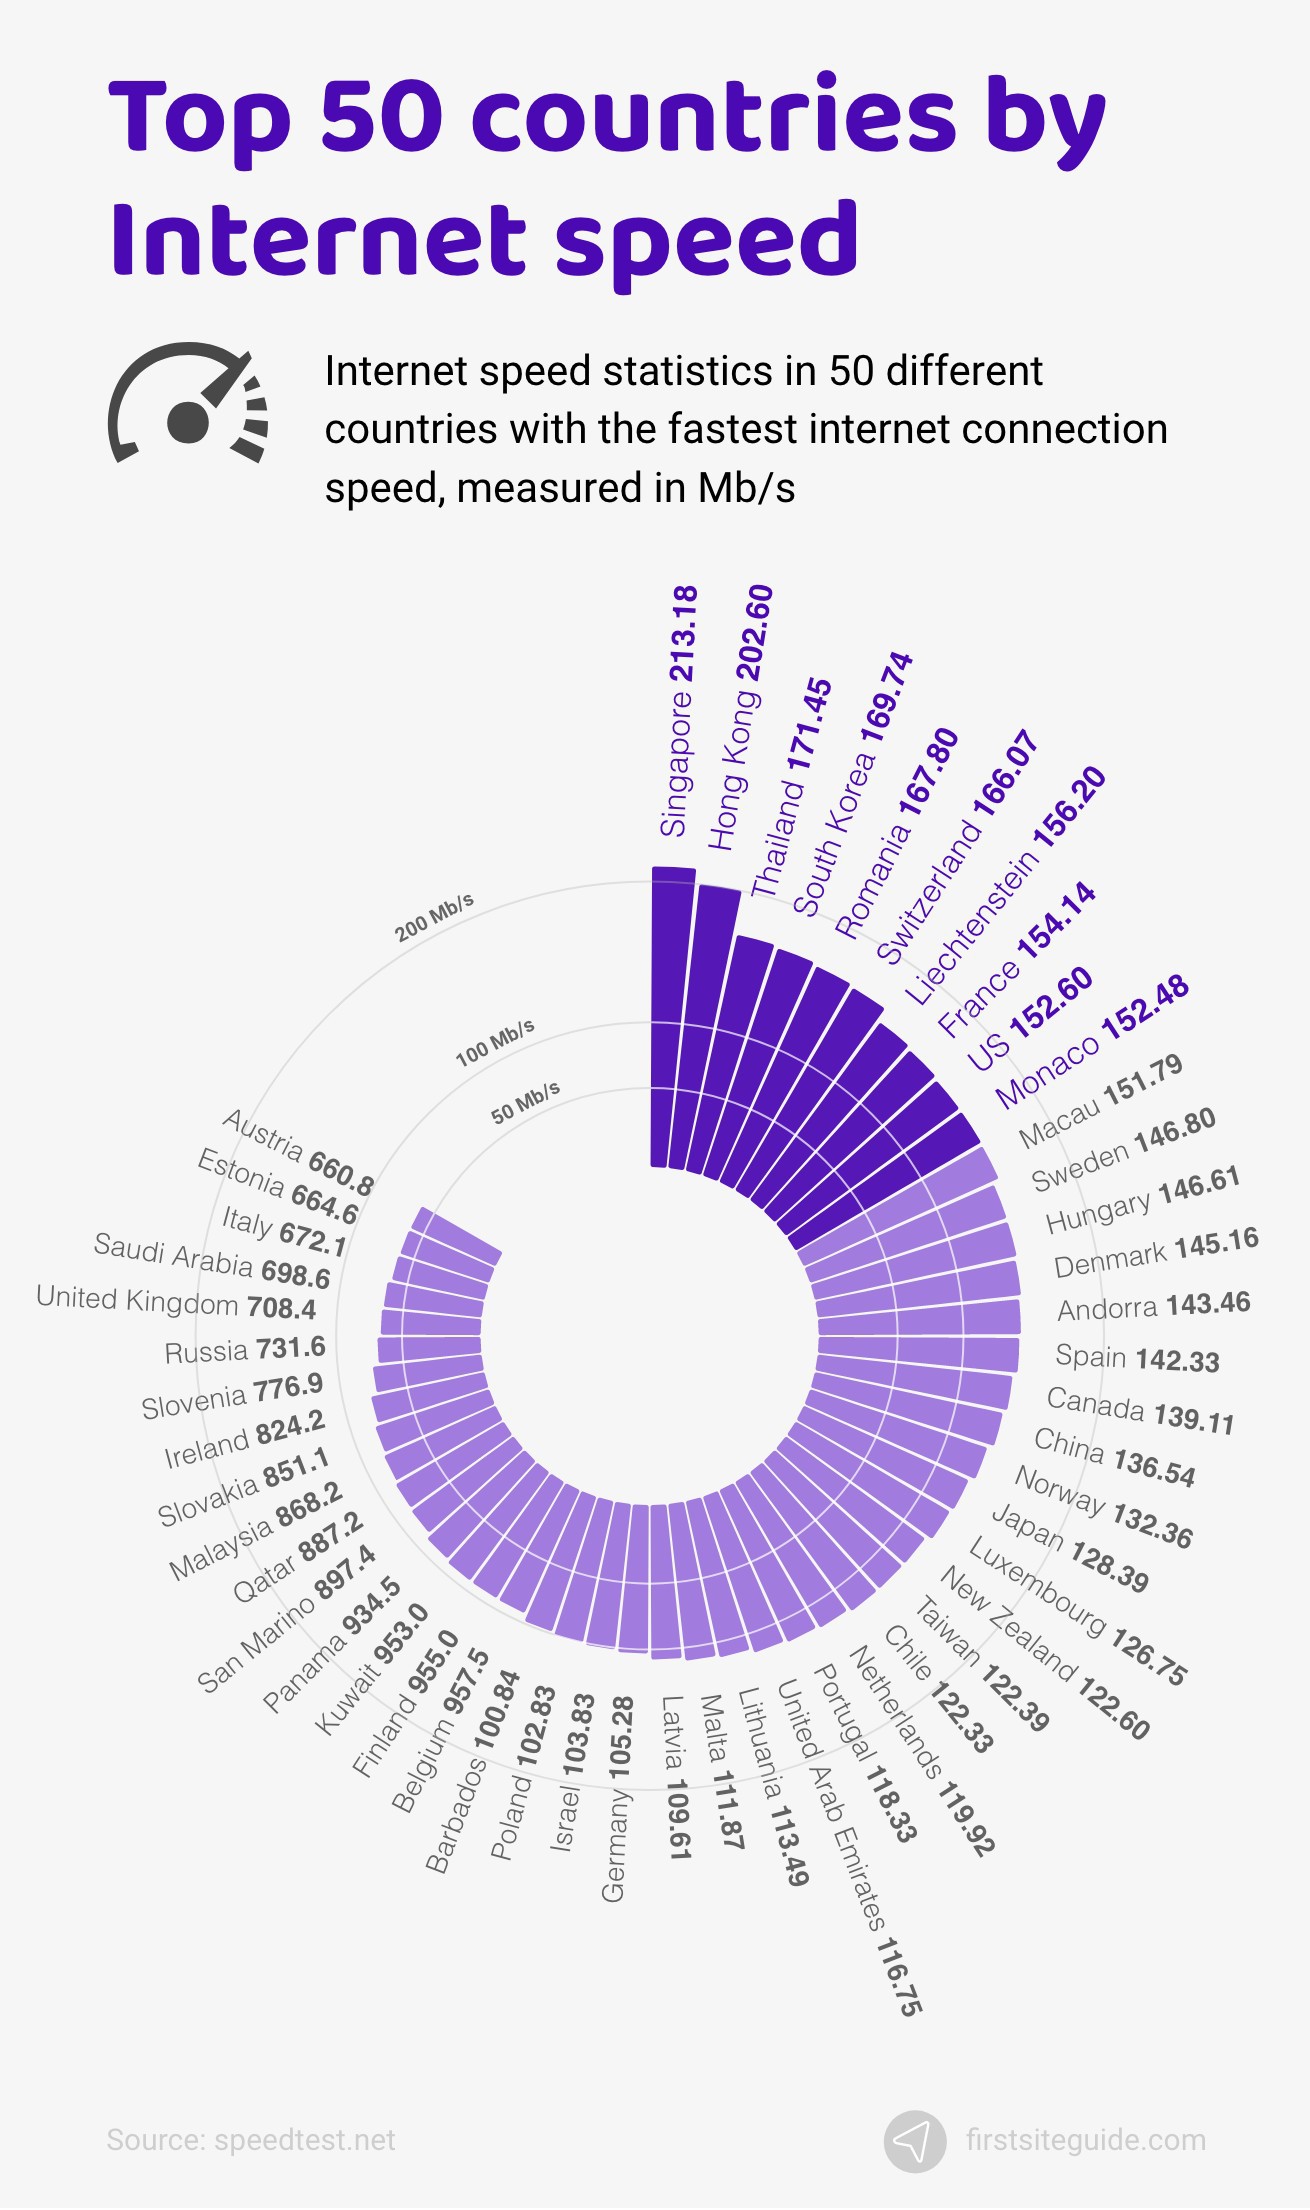
9. Internet connection speed by countries.
The UAE holds the fastest mobile global average internet speed with a fantastic 110.90 Mbps download. The country with the fastest fixed broadband connection in Singapore, with 213.18 Mbps download.
The global average for mobile connections is 34.51 Mbps for download, 10.93 Mbps for upload, and 41 ms latency. The global fixed broadband average is 81.46 Mbps for download, 42.63 Mbps for upload, and 22 ms latency.
(Source: Speedtest and Fastmetrics)
10. 4.4 billion email users registered worldwide in 2023.
As of 2023, there are over 4.4 billion email accounts registered by internet users worldwide, 407 million more than in 2019. This number surpassed the expected 4.3 billion email accounts expected by 100 million. It doesn’t mean that each email is operated by an individual person, as people tend to have multiple email addresses.
(Source: Constantcontact.com)
Web Search Stats
There are a lot of ways to use the internet, as well as interesting facts available about the internet. A common question that is asked is:
“How many people are on the internet right now, and what do people do on the internet exactly?”
To answer this question about how people use the internet, we’ve come up with some more exciting internet statistics about internet users and internet use statistics.
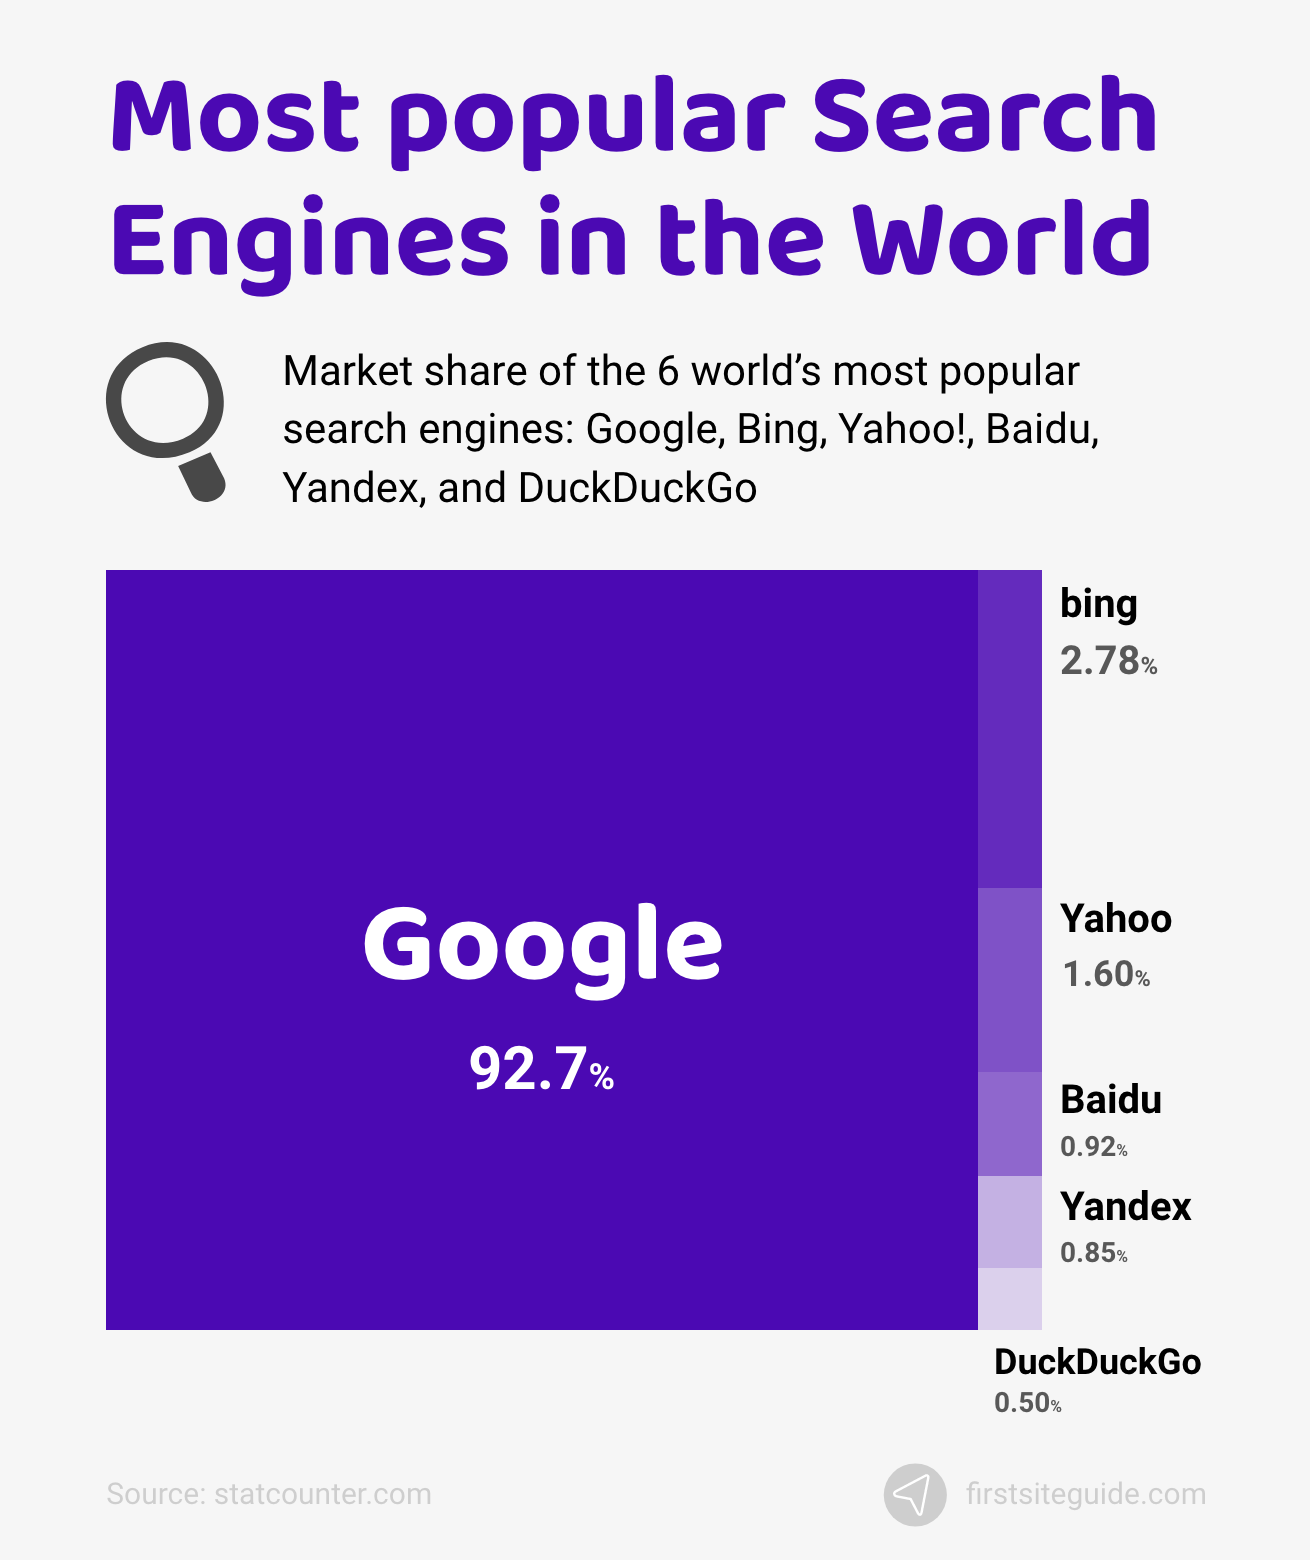
11. Most popular web search engines.
The search engine world is dominated by Google, which is the most popular web search engine according to Google search stats. The top six search engines, according to popularity are:
- Google – 92.7% market share
- Bing – 2.8% market share
- Yahoo! – 1.6% market share
- Baidu – 0.9% market share
- Yandex – 0.8% market share
- DuckDuckGo – 0.5% market share
(Source: Statcounter)
12. 92.17% use the Google search engine.
Google takes the cake for the world’s most popular search engine by a considerable margin. An estimated 92.17% of the global internet population uses Google, which accounts for over 4.206 billion people.
(Source: Statcounter)
13. 2.78% use the Bing search engine.
Bing is a far less popular alternative to Google but it is still the second most popular search engine, with 2.78% of internet users using Bing rather than Google according to internet traffic statistics.
(Source: Statcounter)
14. 1.6% use the Yahoo! search engine.
Launched in 1994, Yahoo is one of the oldest search engines. It is still around, and today, it accounts for 1.6% of the market share according to internet usage statistics.
(Source: Statcounter)
15. 0.92% use the Baidu search engine.
Baidu is a Chinese web search engine and accounts for only 0.92% of the global market share. This internet company specializes in AI and has already overtaken Google in the smart speaker market, holding over 17.3% of the usage.
(Source: Statcounter)
16. 0.85% use the Yandex search engine.
Yandex is the fifth most popular search engine and accounts for 0.85% of the market share according to internet traffic statistics.
(Source: Statcounter)
17. 0.50% the DuckDuckGo search engine.
Last, but not least, is DuckDuckGo. This search engine places a huge emphasis on privacy, and offers uniform SERP for all users, without profiling. This distinction is important for some users, and it accounts for 0.50% of the market share, according to internet traffic statistics.
(Source: Statcounter)
18. 10 most popular websites on the web.
The top 10 most popular websites on the internet according to Alexa are:
- Google.com (Alexa rank: 1)
- Youtube.com (Alexa rank: 2)
- Tmall.com (Alexa rank: 3)
- Baidu.com (Alexa rank: 4)
- Qq.com (Alexa rank: 5)
- Facebook.com (Alexa rank: 6)
- Sohu.com (Alexa rank: 7)
- Taobao.com (Alexa rank: 8)
- 360.cn (Alexa rank: 9)
- Yahoo.com (Alexa rank: 10)
Alexa rank is a measure of website popularity with 1 being the most popular. It is calculated by the site’s estimated traffic and visitor engagement.
(Source: Alexa)
19. Trending Google searches in the US in 2019.
Google trends report the most searched queries on the world’s most popular search engine, according to global internet usage. The top 10 most searched for things in 2019 were:
- Disney Plus
- Cameron Boyce
- Nipsey Hussle
- Hurricane Dorian
- Antonio Brown
- Luke Perry
- Avengers: Endgame
- Game Of Thrones
- iPhone 11
- Jussie Smollett
(Source: Google Trends)
20. In 1990, the first search engine, “Archie Query Form”, was launched.
The first search engine was launched back in 1990 and was named the Archie Query Form. It indexed FTP websites with download files. The websites themselves weren’t available, only downloadable content listings.
(Source: Wordstream)
21. Google Search Index contains more than 100,000,000 GB.
Google is the world’s biggest search engine and includes hundreds of billions of webpages that total up to over 100,000,000 gigabytes in size.
(Source: Google)
Mobile Web Stats
Mobile is a rising platform for internet use, and since smartphones have become as global as the internet, it’s a brand new niche and market that search engines, websites, and the whole internet are trying to appeal to.
The mobile market is breaking records every year, and quite a lot of people enjoy using their mobile phones to access the internet. The smartphone world is full of convenience, along with apps, and it accounts for more than half of all online traffic.
(Source: Hootsuite)
Below, we’ll explore all of the statistics involving mobile phones.
22. 4.32 billion people use their mobile devices to go online.
On a global scale, over 4.32 billion unique users access the internet from their mobile devices. Because there are 4.66 billion internet users, it’s obvious that the vast majority of them use their mobile devices.
(Source: Statista)
23. State of global mobile internet connectivity by region.
The most connected region globally is North America, with over 75% of people having an internet connection. It is closely followed by Europe, in which over 68% of all people have internet access. The region with the least internet connectivity is Sub-Saharan Africa, with 24% of people having internet access according to internet usage statistics.
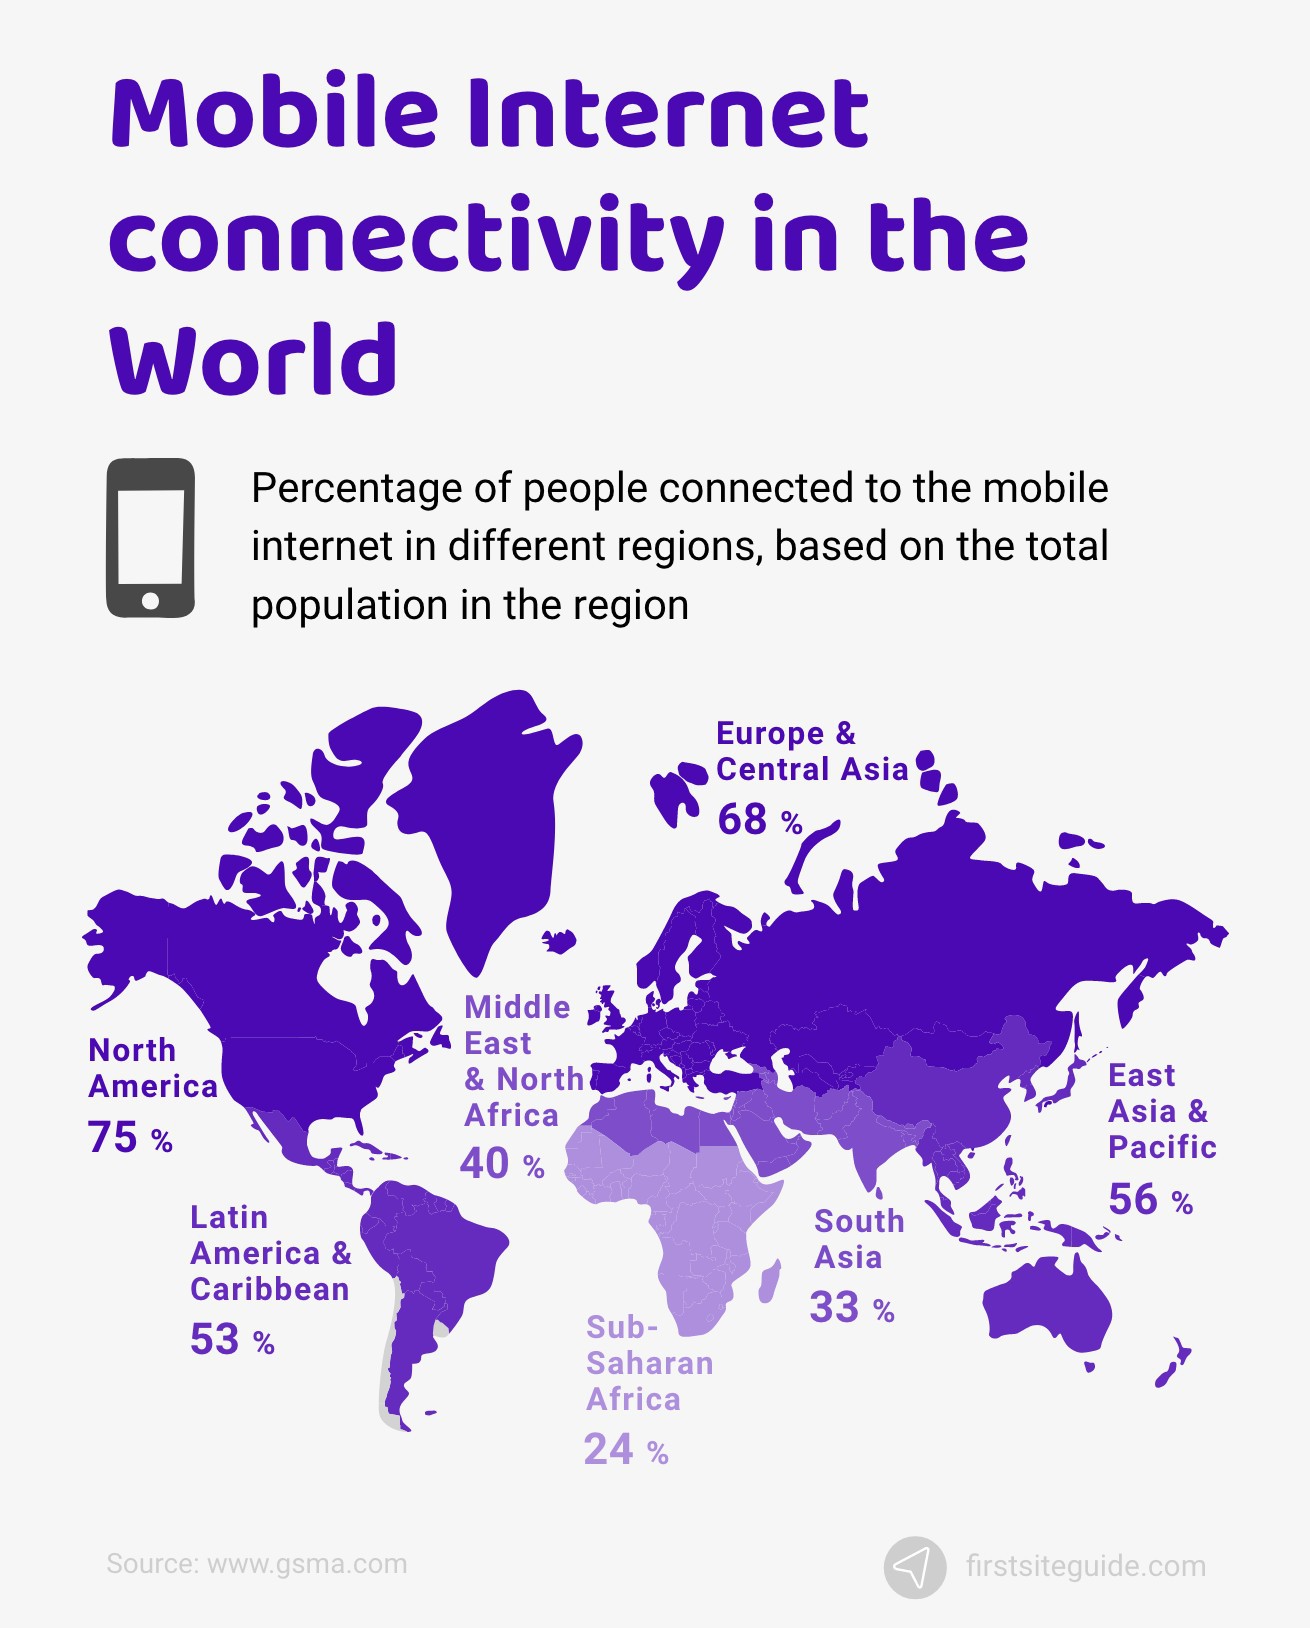
(Source: GSMA
24. The number of mobile users by platform (Android, IOS, etc.)
Most mobile users are using Android OS. Android accounts for a whopping 74.25% of the global market. Next in line is IOS, which holds 25.15% of the mobile global internet usage market. Samsung comes in third place, with 0.23% of the worldwide market. KaiOS and Windows are the least popular ones with 0.08% and 0.03% worldwide usage, respectively.
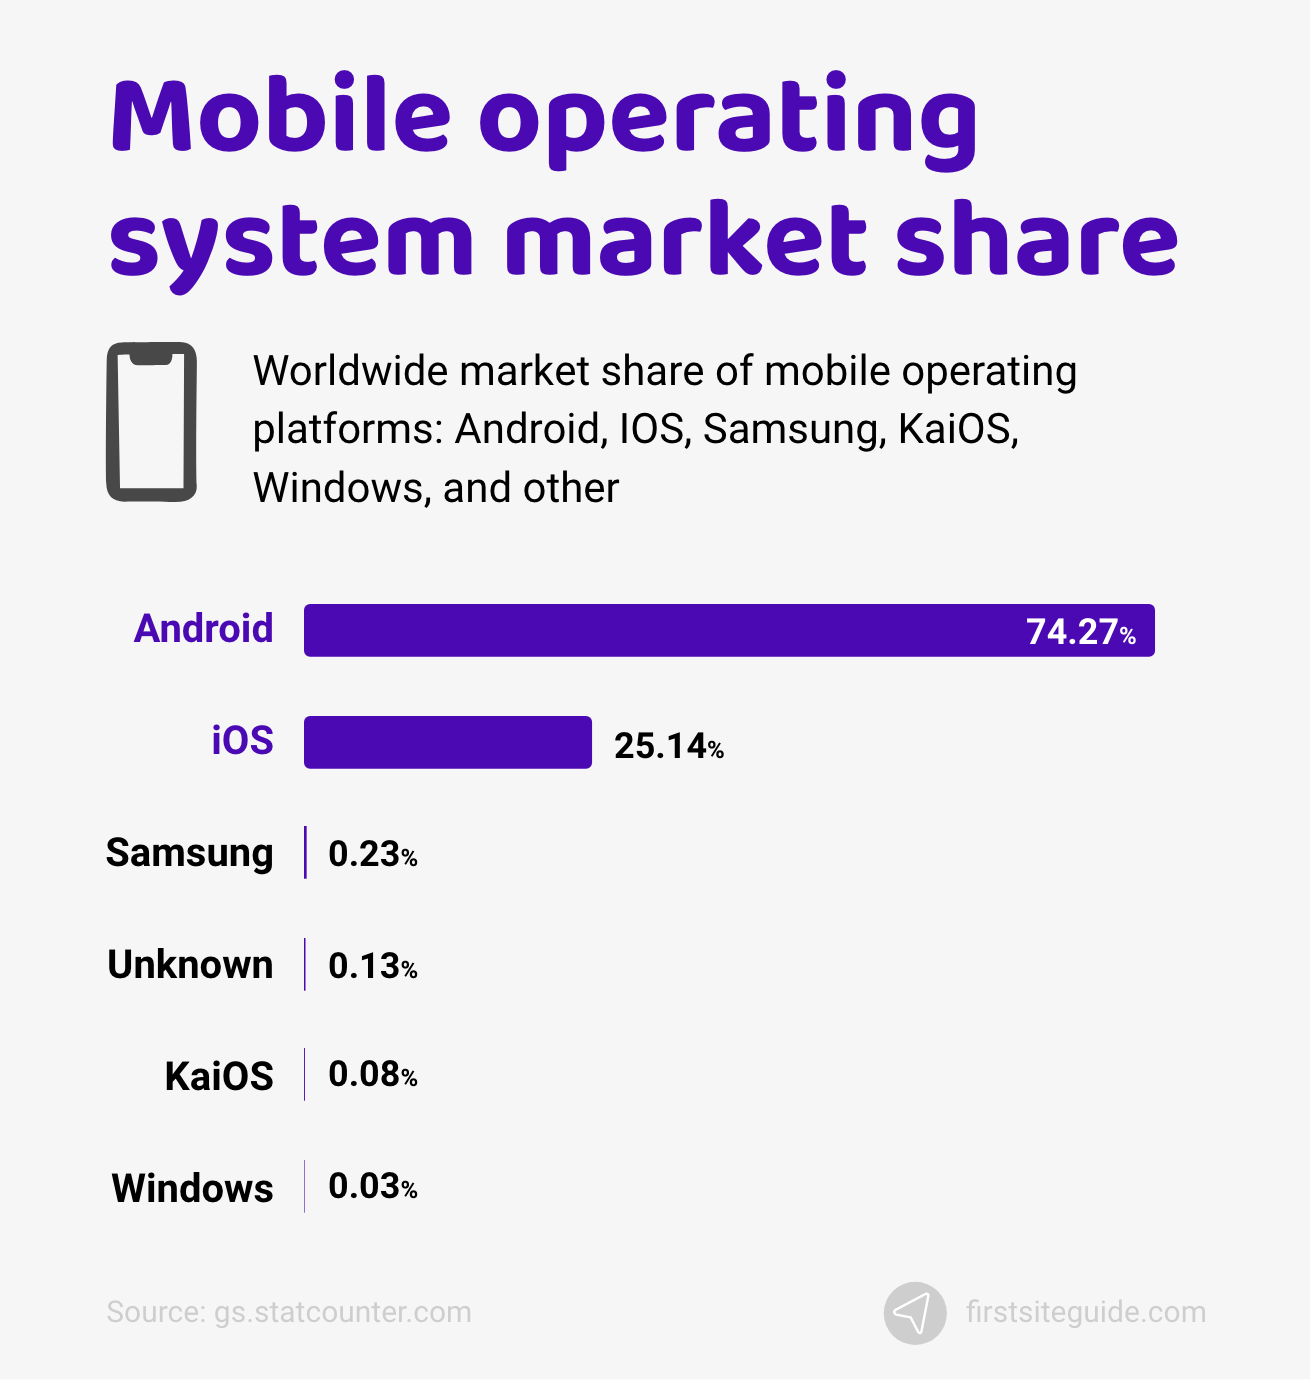
(Source: Statcounter)
25. Most popular applications used on mobile phones.
Based on this research for August 2020, the top ten most popular non-game apps on mobile phones are:
- Tiktok – 63.3 million installs
- Zoom – 52.2 million installs
- Snack Video – 43 million installs
- Google Meet – 38 million installs
- Instagram – 36 million installs
- WhatsApp – 34 million installs
- Snapchat – 24 million installs
- Telegram – 22 million installs
- Facebook – 20 million installs
- Messenger – 17 million installs
(Source: Sensortower)
26. Top countries with the widest mobile network coverage.
The list of the top ten countries with the most comprehensive mobile network coverage is surprising. Below, we’ll list the top ten countries with their internet coverage listed in percentage.
- South Korea – 95.71%
- Japan – 92.03%
- Lithuania – 84.73%
- Hong Kong – 84.52%
- Netherlands – 84.1%
- Singapore – 82.61%
- Norway – 82.42%
- Kuwait – 81.77%
- Sweden – 81.37%
- United States – 81.3%
(Source: Telegraph)
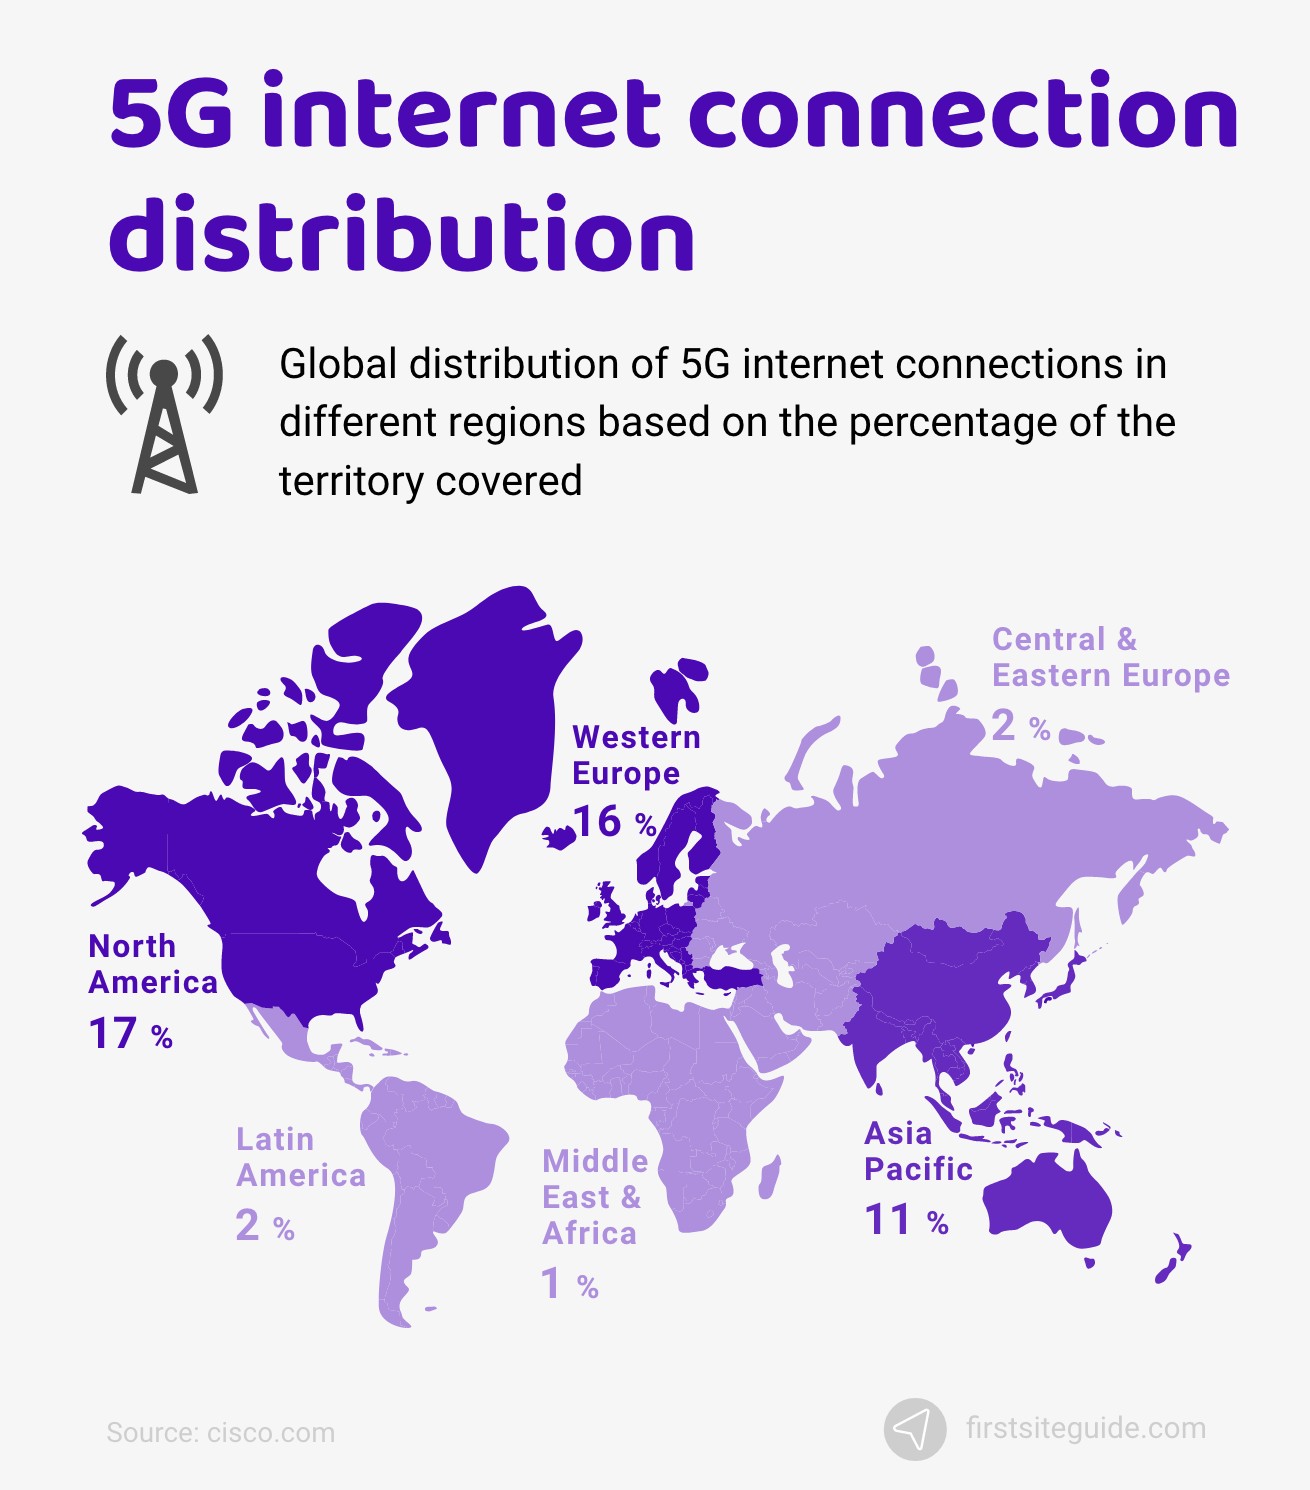
27. 5G network coverage distribution.
5G is the newest internet connection standard. There are over 15376 5G Deployments around the world distributed by 137 5G Operators.
28. Mobile traffic to websites is over 51% of total online traffic.
Mobile internet traffic accounts for 51.53% of global website traffic. PCs and tablets account for 47.04% and 2.63% of all internet traffic, respectively. In the coming years, it’s expected that mobile internet traffic will continue increasing.
(Sources: Statista and Statcounter)
29. Smartphones account for 80% of the total time spent on social media.
Some of the most prominent players in the social media world are Facebook, Twitter, and Instagram. Among many others, these three platforms report that over 80% of the time spent on them is by smartphone users according to internet traffic statistics.
(Source: Comscore)
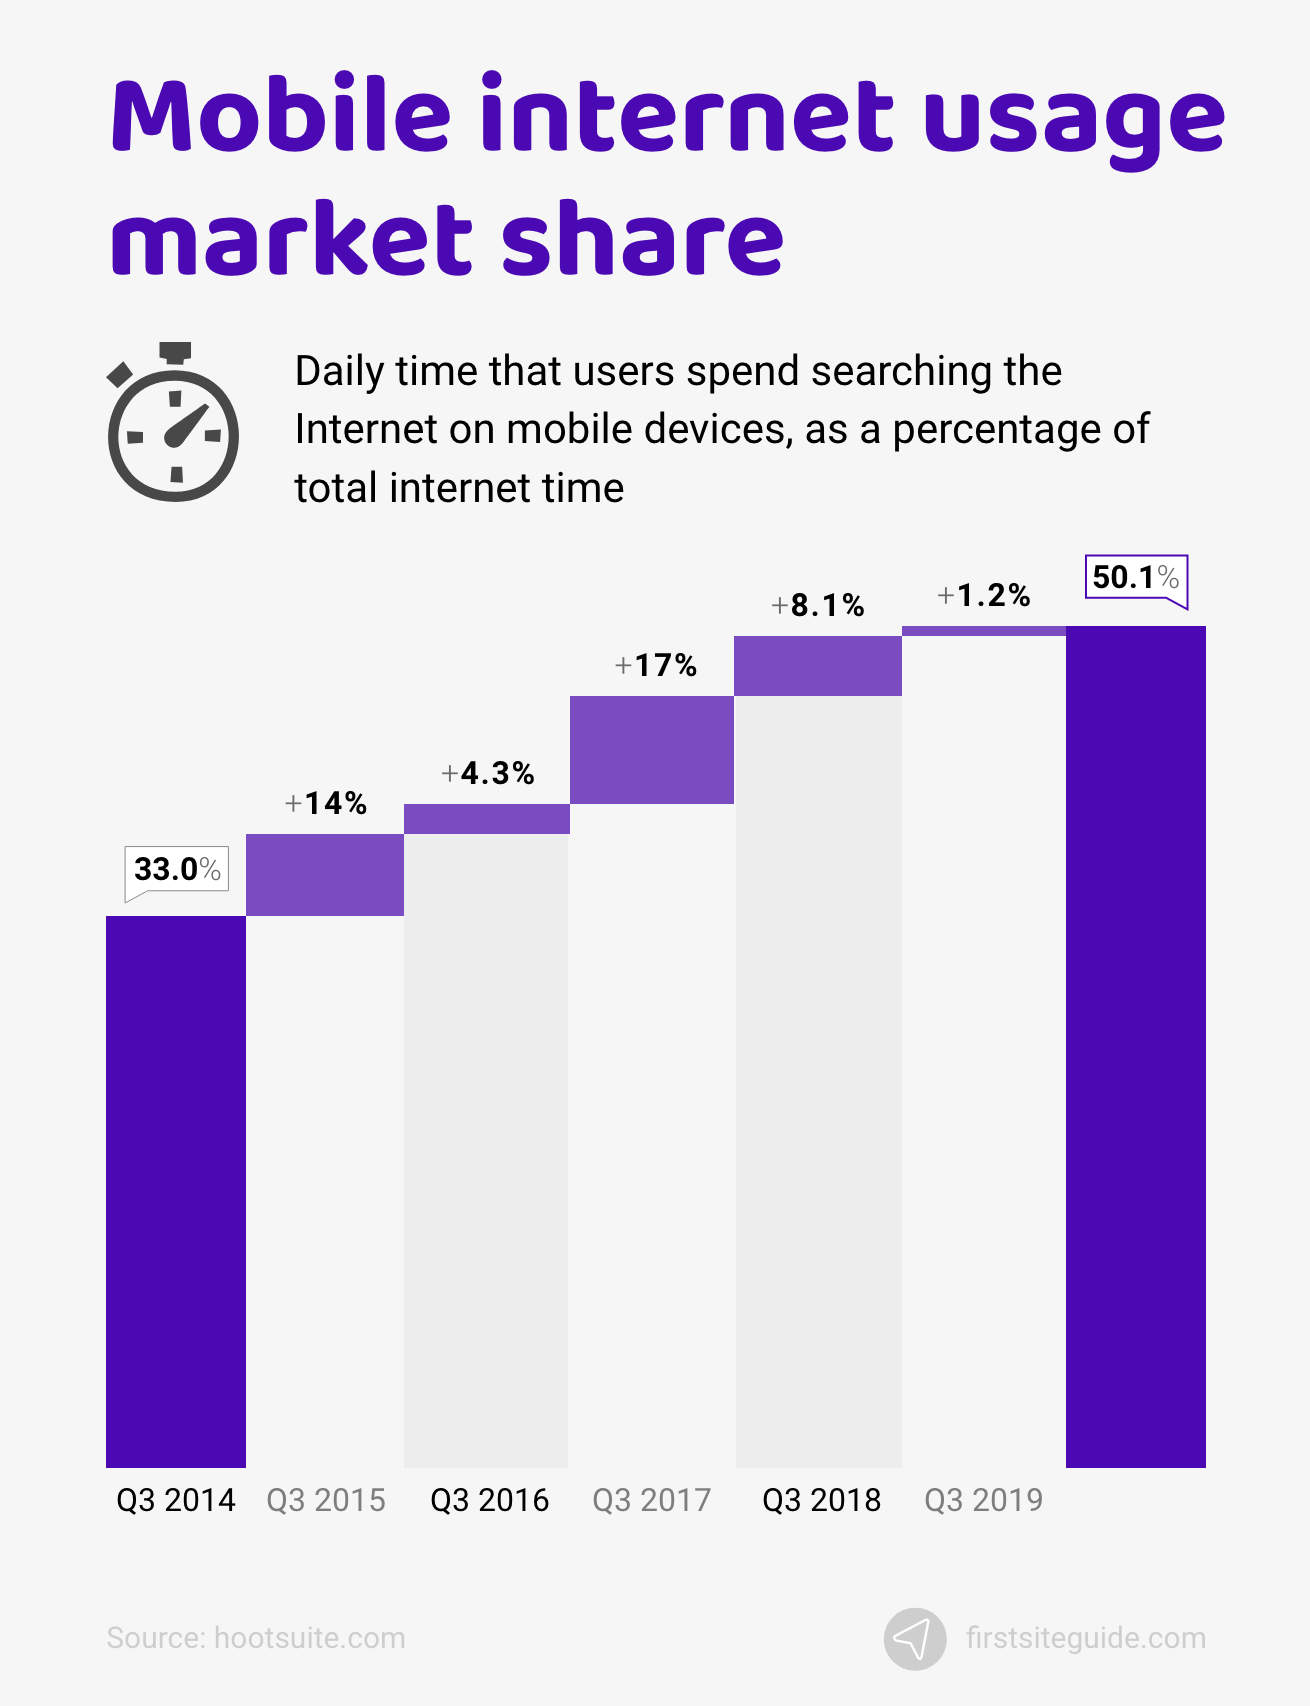
30. People spend an average of 2.8 hours a day browsing the web on smartphones.
In 2010, users spent only 0.4 hours per day browsing the internet via their mobile devices. Today, users spend approximately 2.8 hours doing this. As previously stated, the time spent online via smartphones will continue increasing in the coming years.
(Source: Ezoic)
31. People spend 143 minutes online on mobile devices and 38 minutes a day on a desktop.
The amount of time spent online varies by device. In 2018, internet users worldwide spent 38 minutes a day online on their desktop and 143 minutes online on their mobile devices. It’s expected that the amount of time spent online via desktop will continue dropping. By 2021, it’s likely that users will spend, on average, 155 minutes online via their mobile devices.
(Source: Statista)
Social Media Stats
Social media is one of the most important activities on the internet. While people do spend a lot of time on social media mingling with others and using the service itself, social media internet stats, in general, might seem a bit shocking.
To present you with a full perspective on social media in 2020, we’ve decided to compile some of the most interesting statistics. Below, you can find 15 detailed statistics about social networks and their users.
32. There are 4.2 billion active social media users worldwide in 2021.
More than half the global population is on some sort of social media, with Facebook taking the lead as the most popular option. Almost 4.2 billion people use some social media platform, and 99% of social media users are using their smartphones to access it. The annual growth rate of social media users is a fantastic 10.5%, which accounts for over 376 million unique users.
(Source: Statista and Datareportal)
33. Social media use by age groups.
Most social media requires a minimum age of 13 to join and use. Over 65% of all people over the age of 13 use social media to some extent. Keep in mind, just because there are restrictions doesn’t mean people under the age of 13 don’t use social media.
(Source: Datareportal)
34. By 2025, the number of social media users in the world is expected to grow to 4.41 billion users.
There are a lot of internet users worldwide, and what’s even more surprising is that this number is expected to skyrocket to a whopping 4.41 billion active users globally by 2025. That means that over 56% of people alive will be using the internet by 2025.
(Source: Statista)
35. Most popular social media networks in the world.
Social media is one of the most popular places on the internet. Some popular social media websites globally are Facebook, YouTube, Instagram, Weixin/WeChat, QQ, Qzone, and many more.
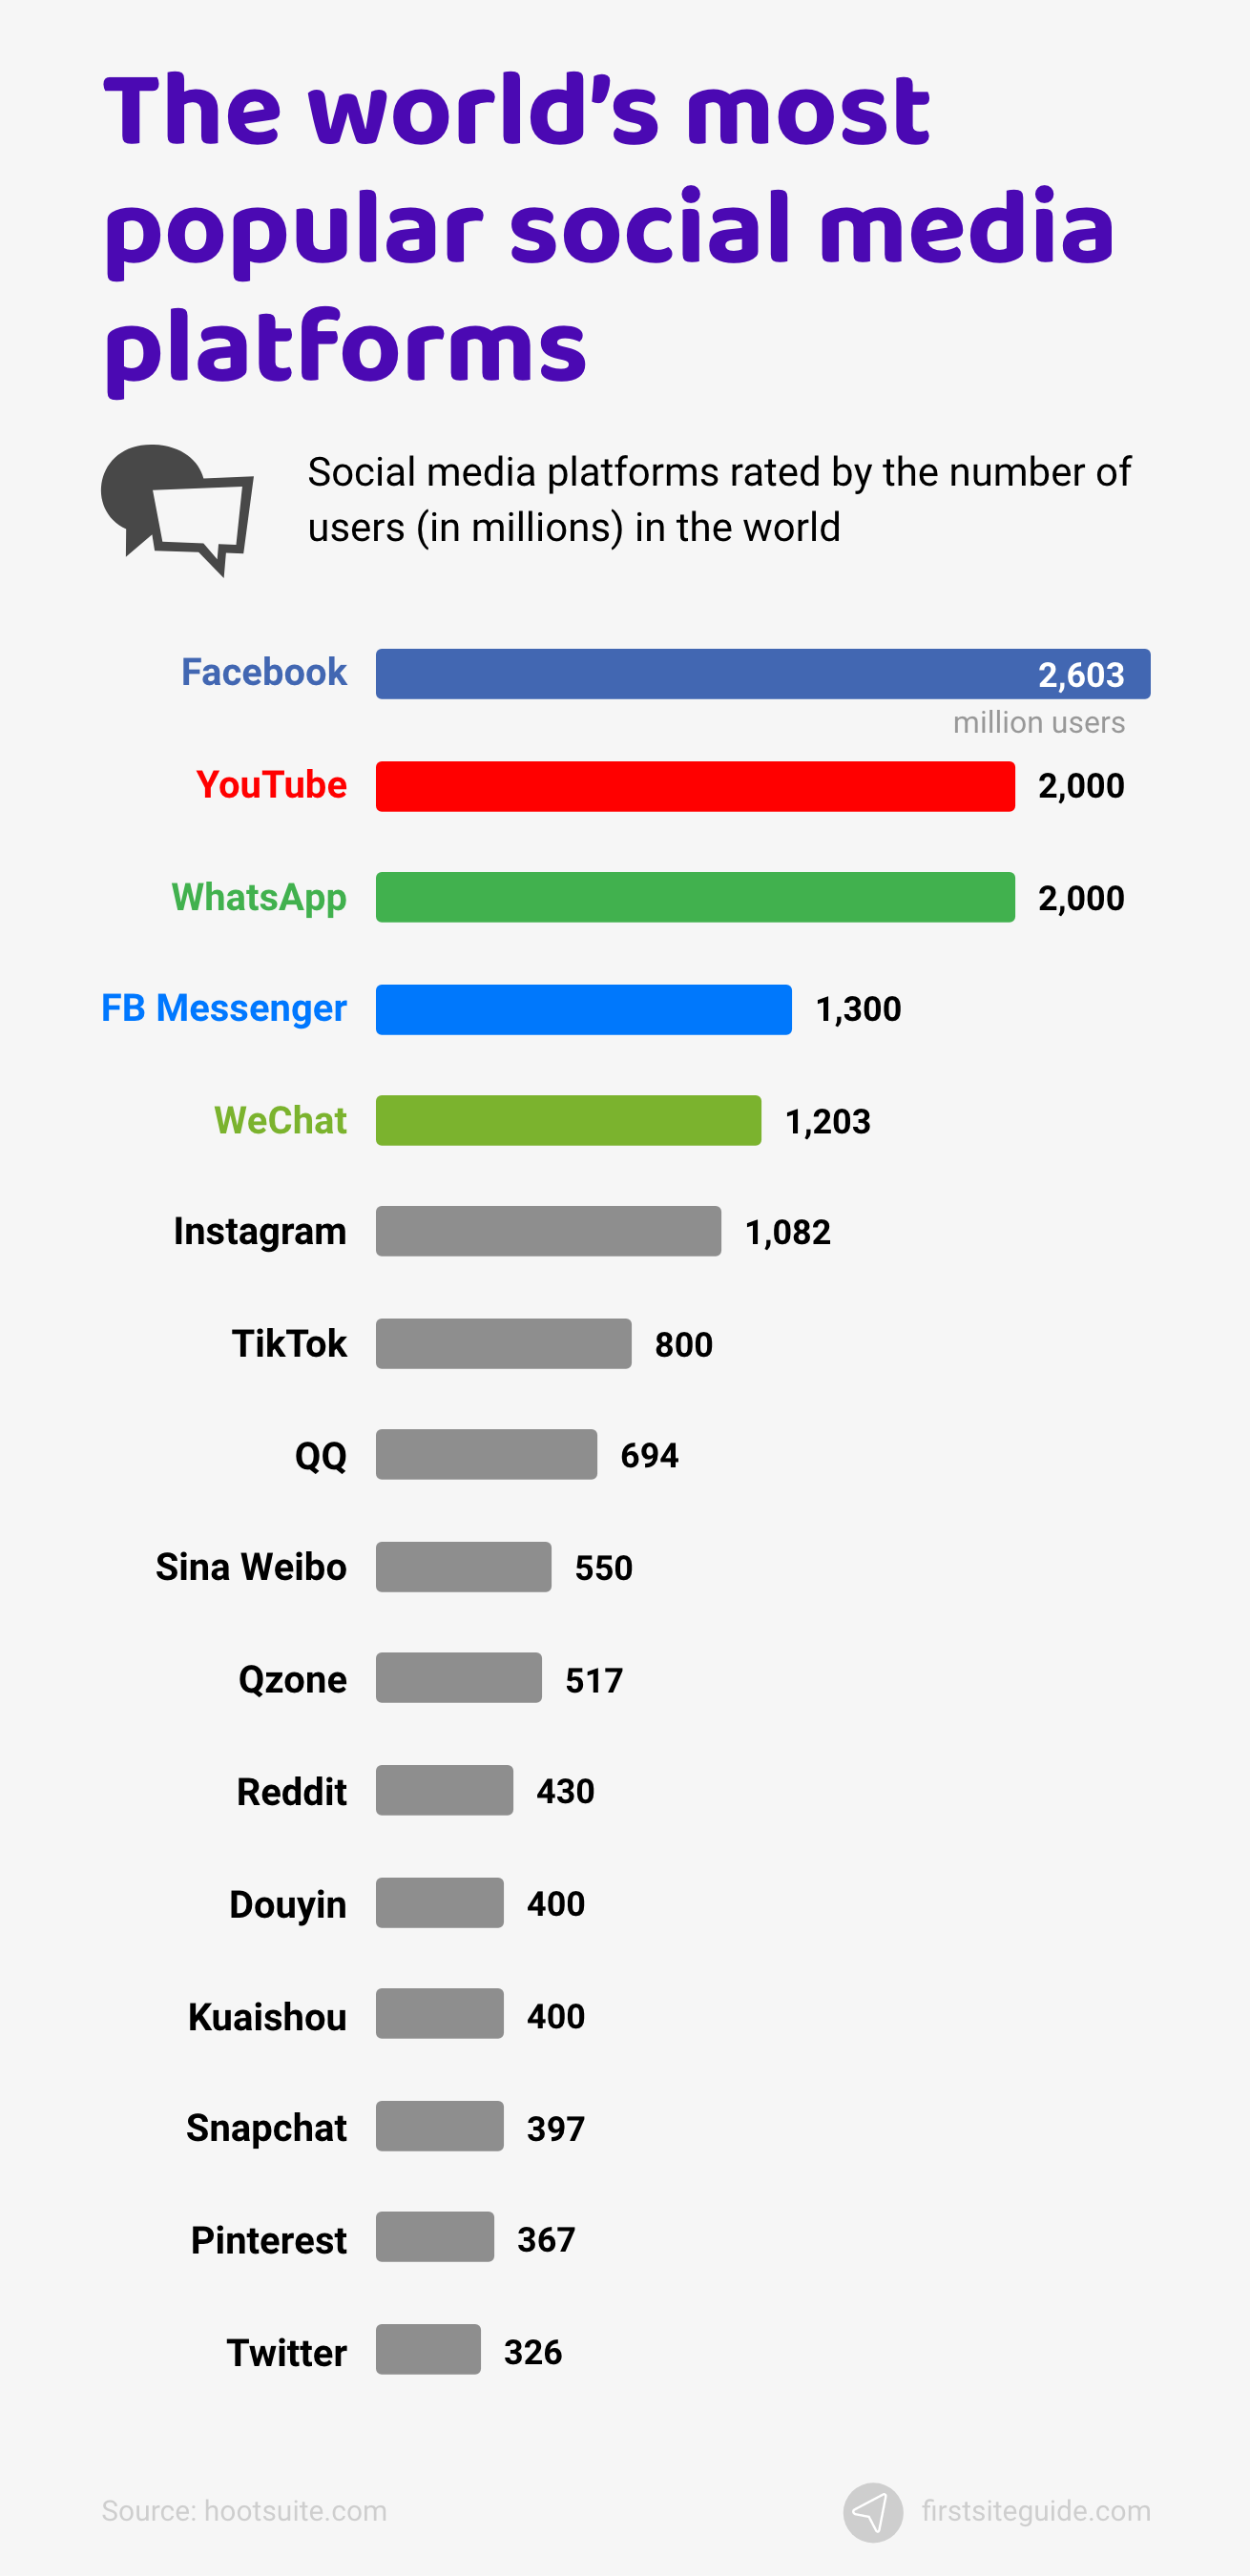
(Source: Statista)
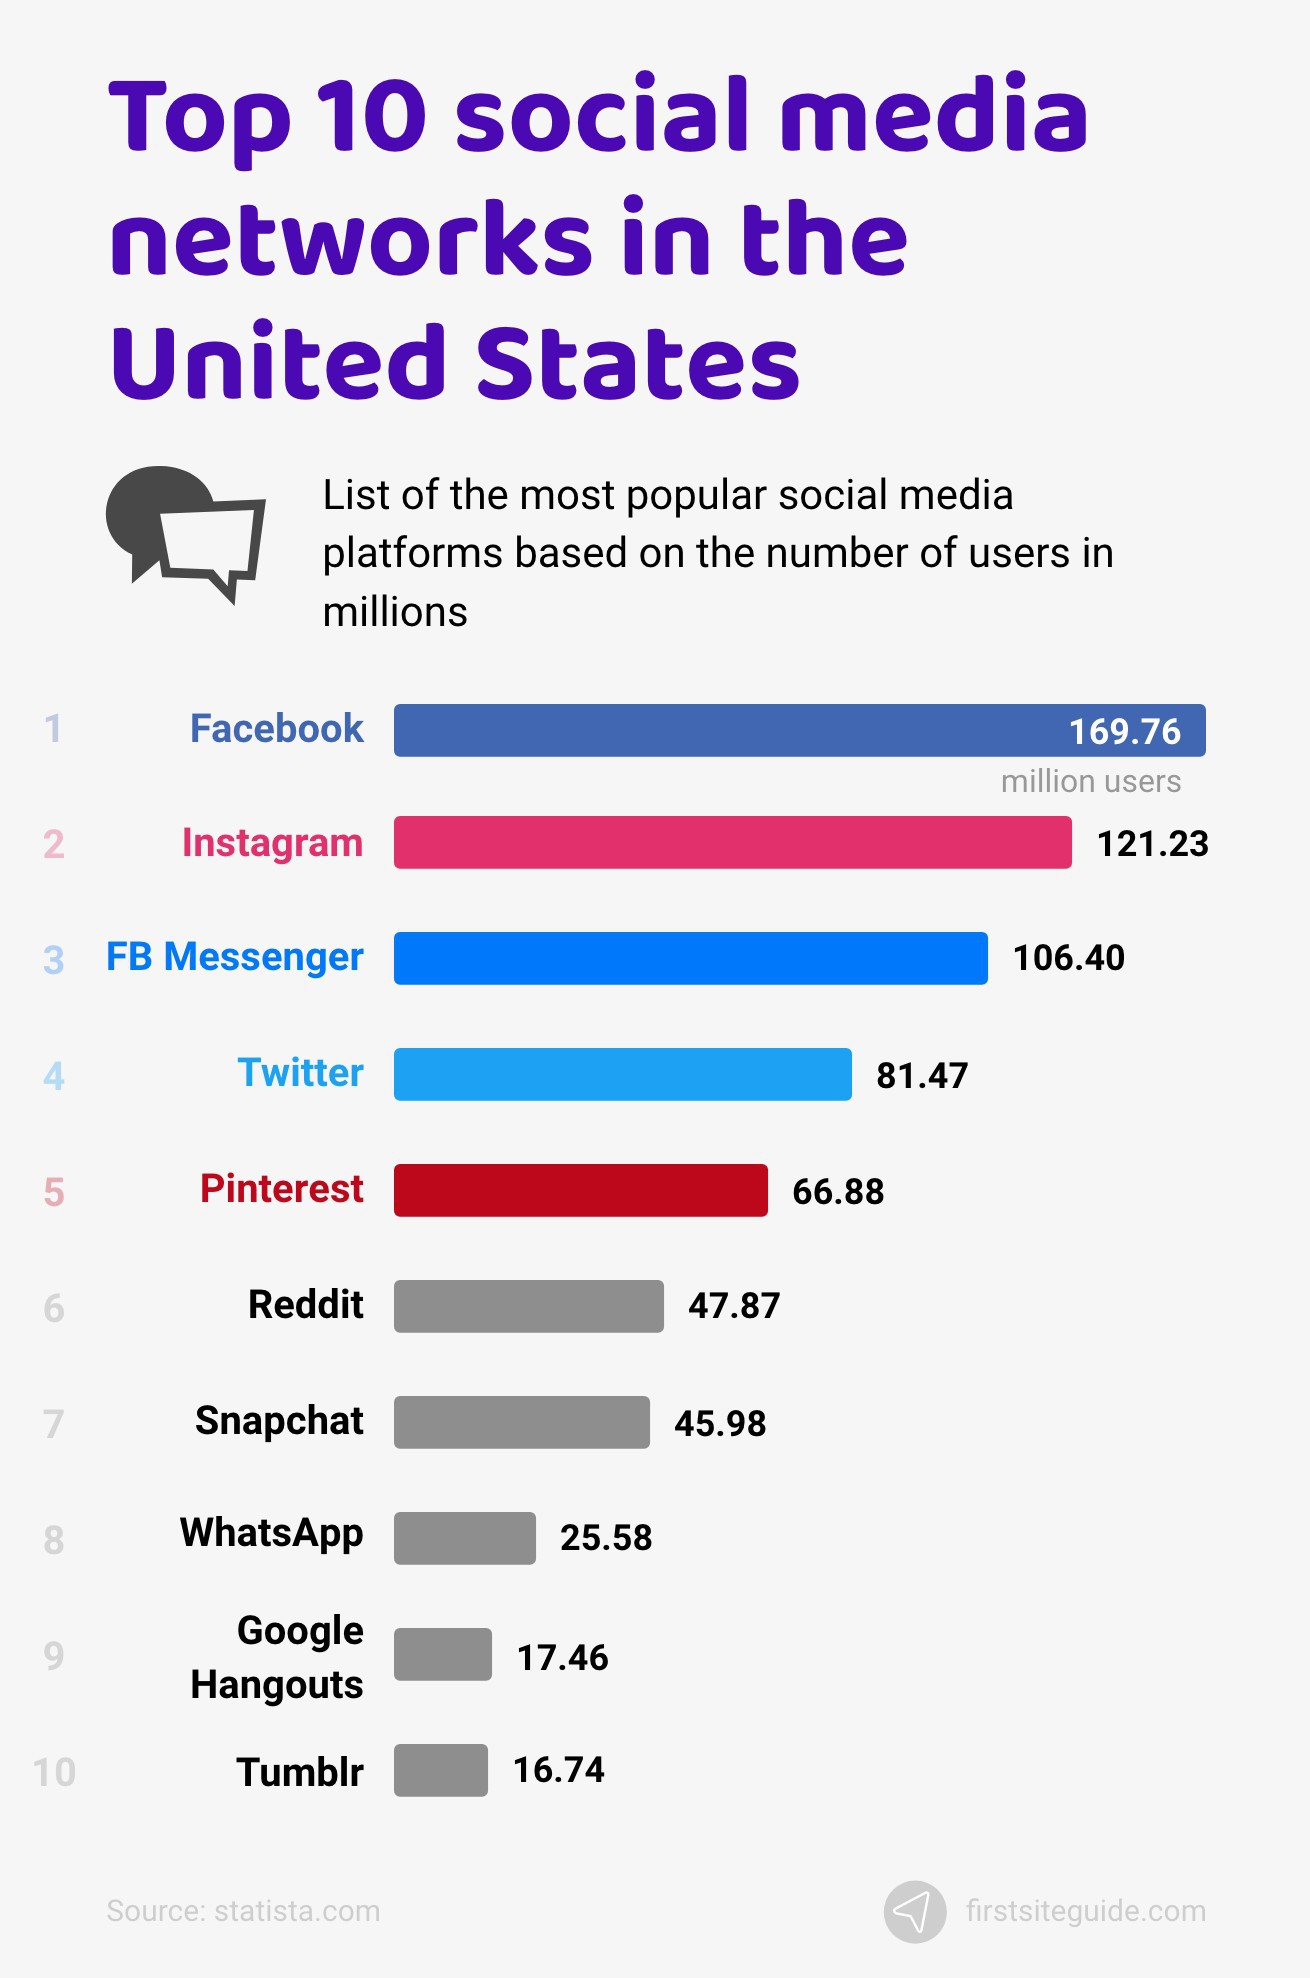
36. Top 10 most popular social media networks in the US.
When it comes to the US, the top 10 most popular social media networks are:
- Facebook – 169.76 million users
- Instagram – 121.23 million users
- Facebook Messenger – 106.40 million users
- Twitter – 81.47 million users
- Pinterest – 66.88 million users
- Reddit – 47.87 million users
- Snapchat – 45.98 million users
- WhatsApp – 25.58 million users
- Google Messenger – 17.46 million users
- Tumblr – 16.74 million users
(Source: Statista and Pewresearch)
37. Over 2.7 billion people use Facebook.
Facebook is, by far, the most popular social media website. It was established back in 2004 and has over 2.7 billion users. Out of the 2.7 billion users, 2.6 billion are active monthly, and they spend up to 58 minutes a day on the website on average, according to internet traffic statistics.
(Source: Dustinstout)
38. YouTube has over 2.3 billion active monthly users.
YouTube is the world’s most popular video-sharing platform. It was established in 2005 and has over 2.3 billion unique users. They spend up to 40 minutes a day on the website on average, according to internet usage statistics.
(Source: Dustinstout)
39. People spend up to 53 minutes daily using Instagram.
Instagram is one of the most popular social networks around and is the world’s most popular place to share pictures. It was established in 2010 and has over 1 billion unique users. Out of these 1 billion users, almost all of them are active monthly, and they spend up to 53 minutes daily on the website on average, according to internet traffic statistics.
(Source: Dustinstout)
40. 62.5% of all TikTok users use the service at least once a month.
TikTok is a popular video-sharing social media platform. It was established in 2016 and has over 800 million unique users. Out of the 800 million users, only 500 million are active monthly, and they spend up to 52 minutes a day on the website on average, according to internet usage statistics.
(Source: Dustinstout)
41. Reddit has 330 million active monthly users.
Reddit is one of the most popular social networks and is the world’s most popular message board. It was established in 2005 and has over 430 million unique users. Out of these 430 million users, almost 330 million are active monthly, and they spend up to 13 minutes a day on the website on average, according to internet traffic statistics.
(Source: Dustinstout)
42. There are over 4 billion snaps on Snapchat every day.
Snapchat is one of the most popular multimedia messaging apps. It was established in 2011 and has over 360 million unique users. Out of these 360 million users, almost 314 million are active monthly, and they spend up to 25 minutes a day on the website on average, according to internet usage statistics.
(Source: Dustinstout)
43. Users spend up to 14 minutes a day on Pinterest.
Pinterest is one of the most popular image sharing/social network combinations on the internet. It was established in 2009 and has over 300 million unique users. Out of the 300 million users, almost 291 million are active monthly, and they spend up to 14 minutes a day on the website on average, according to internet traffic statistics.
(Source: Dustinstout)
44. Twitter has over 1.3 billion unique users.
Twitter is one of the most popular microblogging social media websites in the world. It was established in 2006 and has over 1.3 billion unique users. Out of 1.3 billion users, almost 330 million are active monthly, and they spend only 1 minute a day on the website on average, according to internet usage statistics.
(Source: Dustinstout)
45. 52% of all LinkedIn users use the service monthly.
Linkedin is the most popular business and employment-oriented social media website in the world. It was established in 2003 and has over 575 million unique users. Almost 303 million are active monthly, and they spend up to 10 minutes a day on the website on average, according to internet traffic statistics.
(Source: Dustinstout)
46. There are over 545 million blogs on Tumblr.
Tumblr, much like Twitter, is one of the world’s most popular microblogging social media platforms. It was established in 2007 and has over 545 million unique users. Almost 371 million are active monthly, and they spend up to 10 minutes a day on the website on average, according to internet usage statistics.
(Source: Tumblr)
47. Daily time spent on social media.
It’s no secret that people like social media, and with the staggering amount of users, the fact that the average time spent on social media exceeds 2 hours and 22 minutes per day is no surprise at all.
(Source: Hootsuite)
48. Social media networks behavior during COVID-19 pandemic.
Studies show that the coronavirus pandemic has impacted the use of social media by a considerable margin. Almost all social media websites have experienced an increase in traffic during varying stages of a global pandemic, as more internet users in the world are stuck at home.
(Source: eMarketer)
Domains, Websites, and Web Hosts
While websites might be abundant and widespread, they all rely on web hosting and domains.
A web hosting service makes your website accessible through traditional means, and domain addresses are identification strings used to make your website accessible through a link.
There are many interesting internet facts, statistics, and numbers that apply to domain names, website hosting, and websites as a whole. Below, we’ll explore some of the most interesting ones.
49. 364 million, the total number of domain names in the world in 2021.
There are a lot of domain names around the world that are used to identify specific websites. The total number of domain names in 2021 is 364.6 million, with the .com domain base being the most popular pick for internet users.
(Source: Verisign)
50. Almost half (43.8%) of the total number of domains are .com and .net.
Out of all of the domain names registered, 43.8% are either .com or .net. Internet world stats state that the most popular domain extension is .com, which accounts for over 158.6 million websites. The second most popular extension, .net, accounts for only 13.5 million websites around the world. The third most popular TLD ( Top-Level Domain ) is .org.
(Source: Verisign)
51. Top 10 TLD extensions by the number of registered domain names.
TLD stands for Top-Level Domain, which is the highest level in the Internet DNS (Domain Name System). The top 10 most popular TLDs are:
- .com – 158.6 million domains
- .tk – 27.5 million domains
- .cn – 24.1 million domains
- .de – 16.5 million domains
- .net – 13.5 million domains
- .uk – 11.8 million domains
- .org – 10.1 million domains
- .nl – 6.0 million domains
- .icu – 5.9 million domains
- .ru – 5.7 million domains
(Source: Verisign)
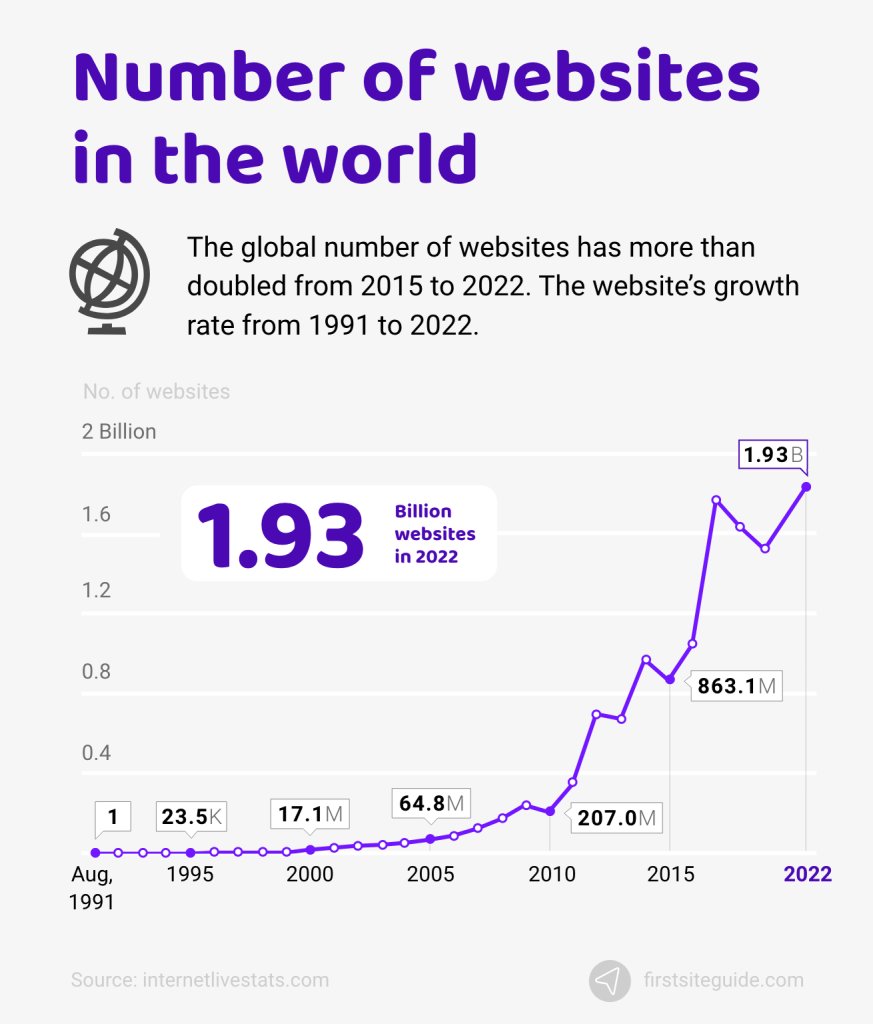
52. There are more than 1.93 billion websites online.
Have you ever wondered how many websites are on the internet? Currently, the number of websites is over 1.93 billion, and that number increases every second. The first website was created in 1991. Then, it took 23 years for the internet to reach its first 1 billion sites.
(Source: Internetlivestats)
53. The first-ever website dates back to 1991.
The first-ever website was launched on August 6th, 1991. The developer behind it was a CERN employee, Tim Berners Lee. The site was about his World Wide Web project. Tim refused to patent the project, and his Web technology became open to the public.
In 1993, Mosaic, the first web browser was released to the public. It cataloged download links from a number of websites.
(Source: History)
54. 202 million active websites on the web.
There are a lot of active websites on the World Wide Web, with the total number of websites exceeding 202,048,898. All of these are based on 263,042,054 unique domains that operate through 10,766,606 web-facing computers. This accounts for an overall loss of active websites and web-facing computers, but an increase of unique domains.
(Source: Netcraft)
55. Around 7 million blog posts get published per day.
With the number of active blogs climbing over 600 million, it’s not surprising to find out that over 7 million blog posts are published daily. This is exceptionally high when you consider the fact that many blog sites don’t actually post every single day.
(Source: Internet Live Stats)
56. Over 28% of active sites use content management systems.
CMS technology is highly beneficial for all websites, especially active websites. Global internet usage studies show that over 54.4 million active websites are using CMS technology, and 44% of all active websites using CMS solutions are also using WordPress.
(Source: Builtwith)
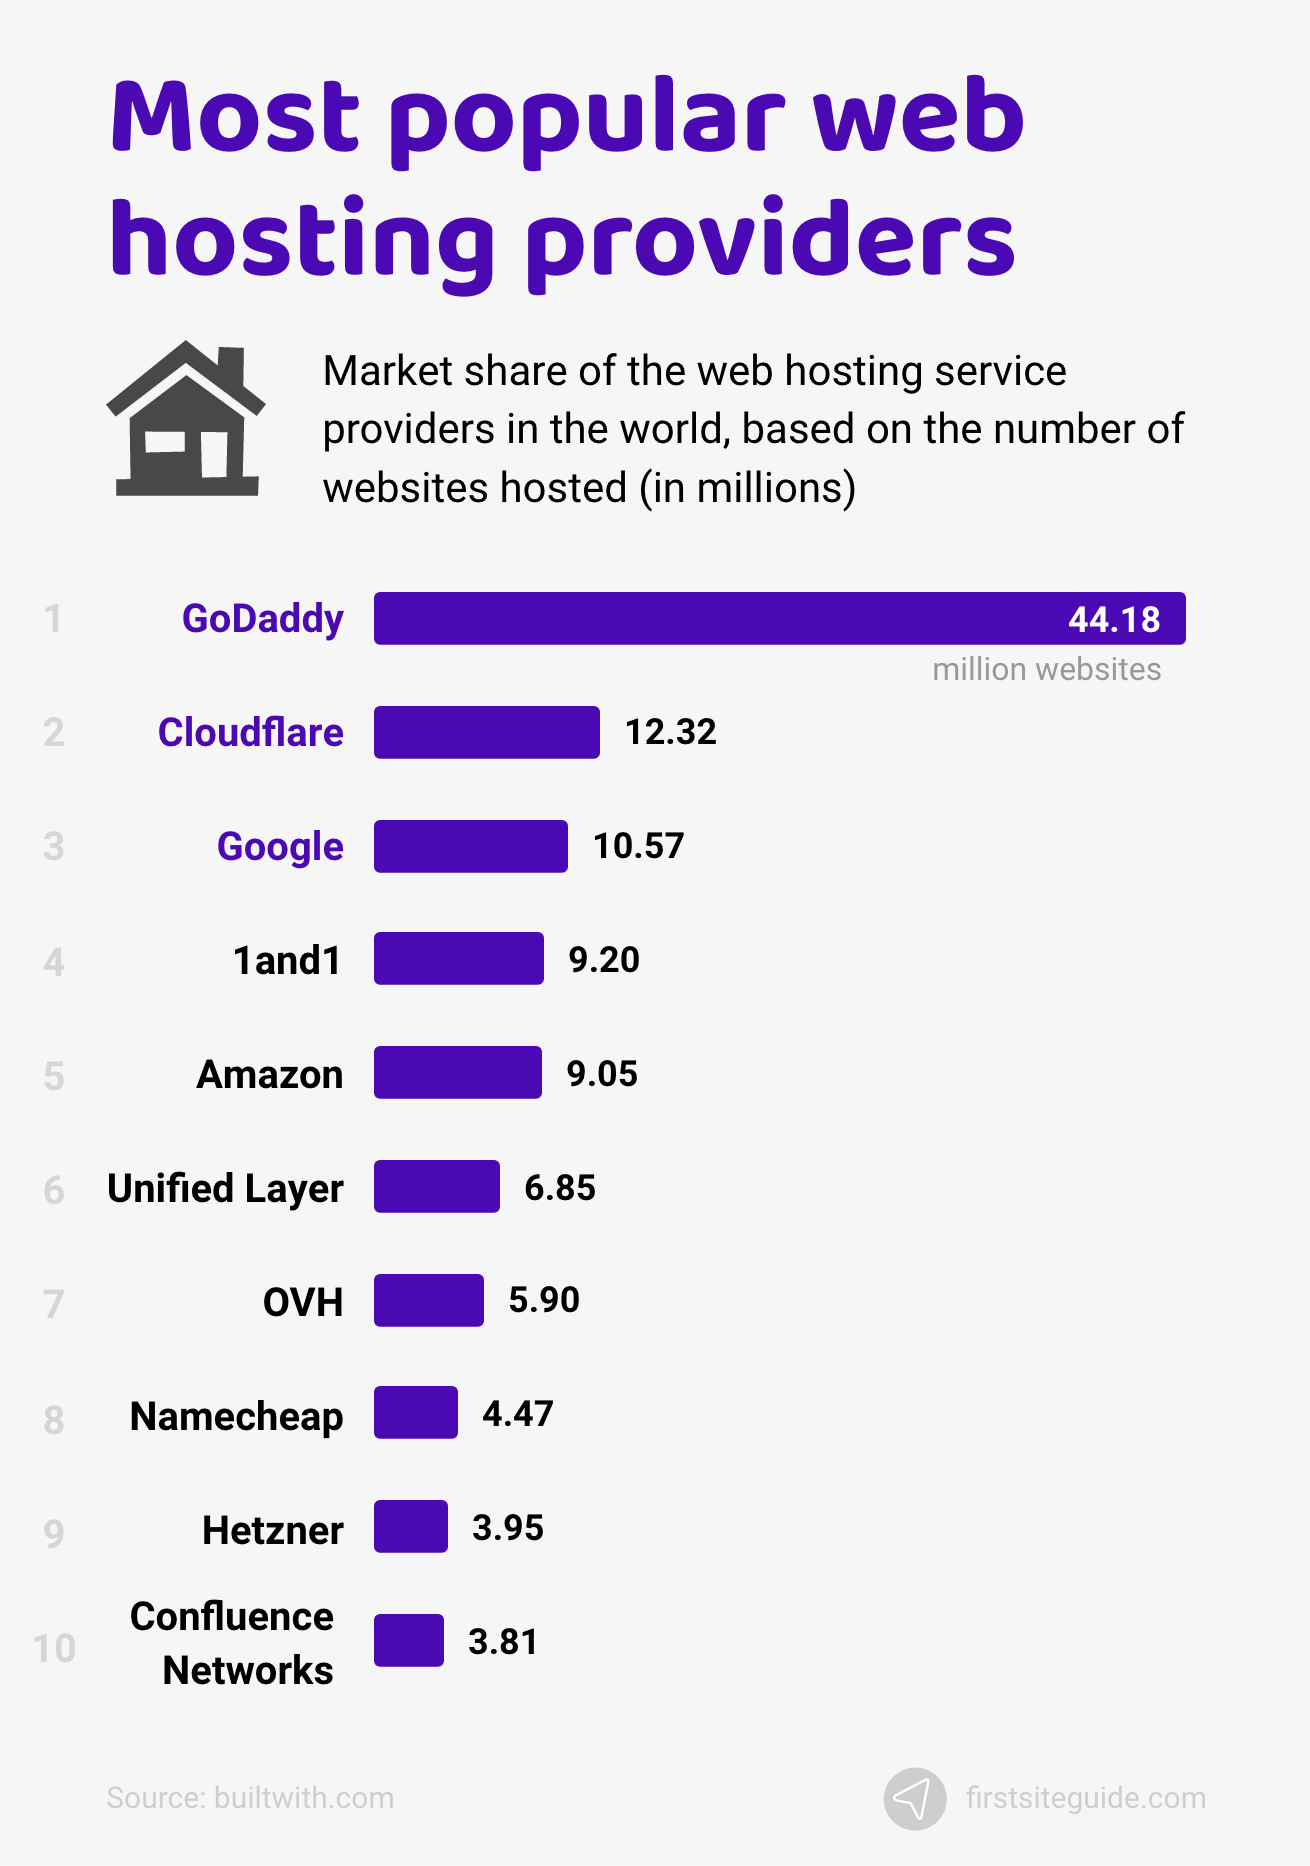
57. Most popular website hosting providers.
There are many website hosting providers, the most popular of which is GoDaddy, which hosts over 44 million websites. Companies that sell server and data center space such as Cloudflare, Amazon, Google, Unified Layer, OVH, and others are also considered website hosting providers.
Below, we’ll list 10 of the most popular website hosting providers and the number of websites each provider hosts.
Top 10 web hosting providers:
- GoDaddy – 44.18 million websites
- Cloudflare – 12.32 million websites
- Google – 10.57 million websites
- 1and1 – 9.20 million websites
- Amazon – 9.05 million websites
- Unified Layer – 6.85 million websites
- OVH – 5.90 million websites
- Namecheap – 4.47 million websites
- Hetzner – 3.95 million websites
- Confluence Networks – 3.81 million websites
(Source: Builtwith)
58. Most popular website building tools around the web.
Websites weren’t always as accessible as they are today. In the past, making a website required extensive coding, took a long time, and used to cost a lot of money. The global internet was far smaller. Today, there are many website building solutions that do most of the work for you.
Everyone can create a website these days through a website building tool. Below, we’ll list the ten most popular website building tools alongside the number of websites built using their services.
Top 10 hosted website platforms:
- Wix – 3.80 million websites
- Squarespace – 2.27 million websites
- Shopify – 1.48 million websites
- Automattic – 1.06 million websites
- Weebly – 0.94 million websites
- Duda – 0.58 million websites
- Jimdo – 0.41 million websites
- 1and1 – 0.24 million websites
- Tilda – 0.15 million websites
- Web.com – 0.07 million websites
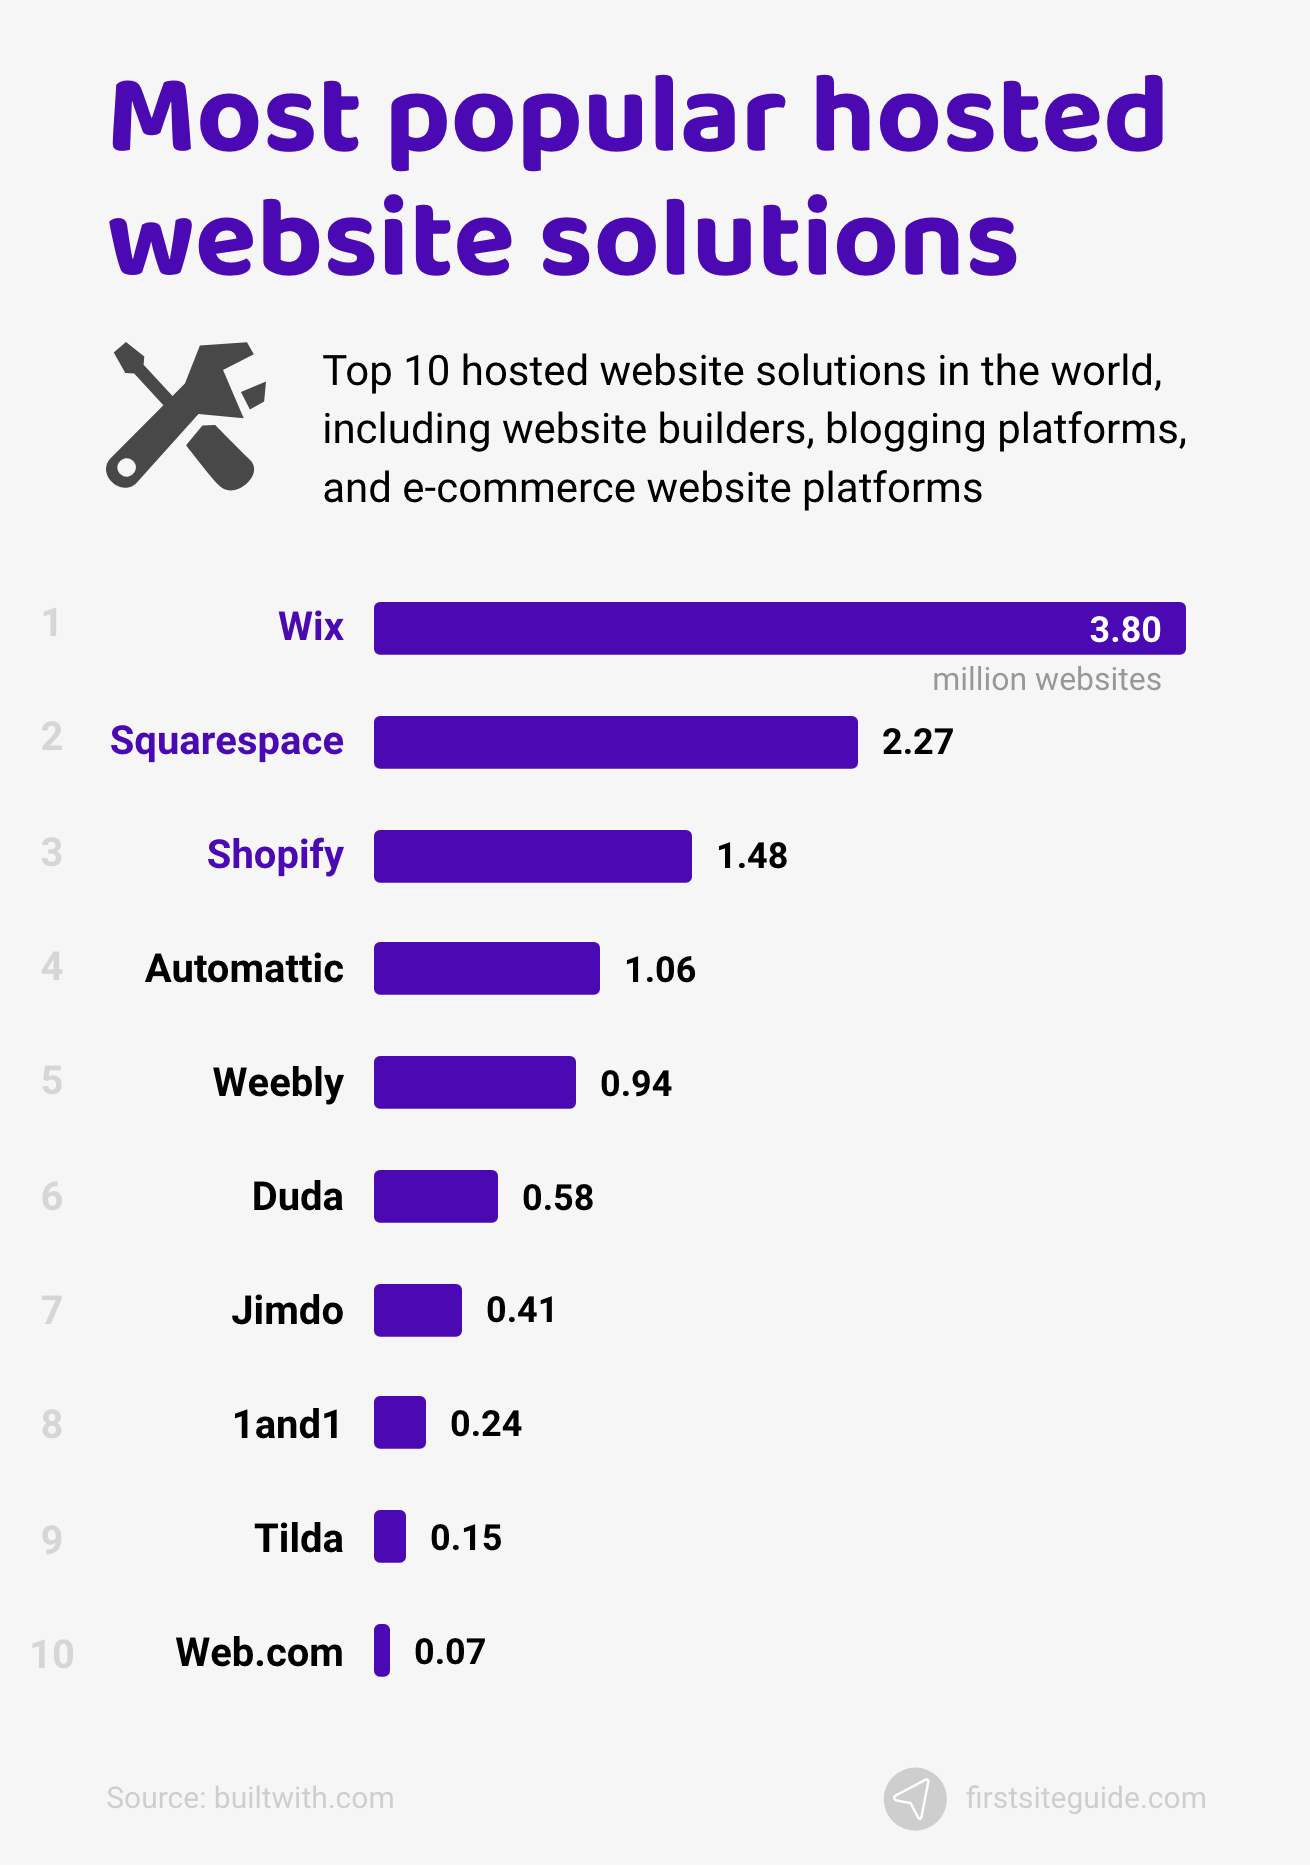
(Source: Builtwith)
eCommerce Stats
eCommerce is dominating the shopping landscape. With the largest eCommerce website being Amazon, and with Jeff Bezos being the world’s richest person by a considerable margin, it’s not hard to believe that eCommerce online shops make up a substantial portion of the internet around the world.
eCommerce has revolutionized the way we shop. There is no more waiting in lines for the latest products to drop. Today, we click a couple of buttons and have our desired products delivered to our doorstep. This is the magic of eCommerce, and below are some interesting stats about it!
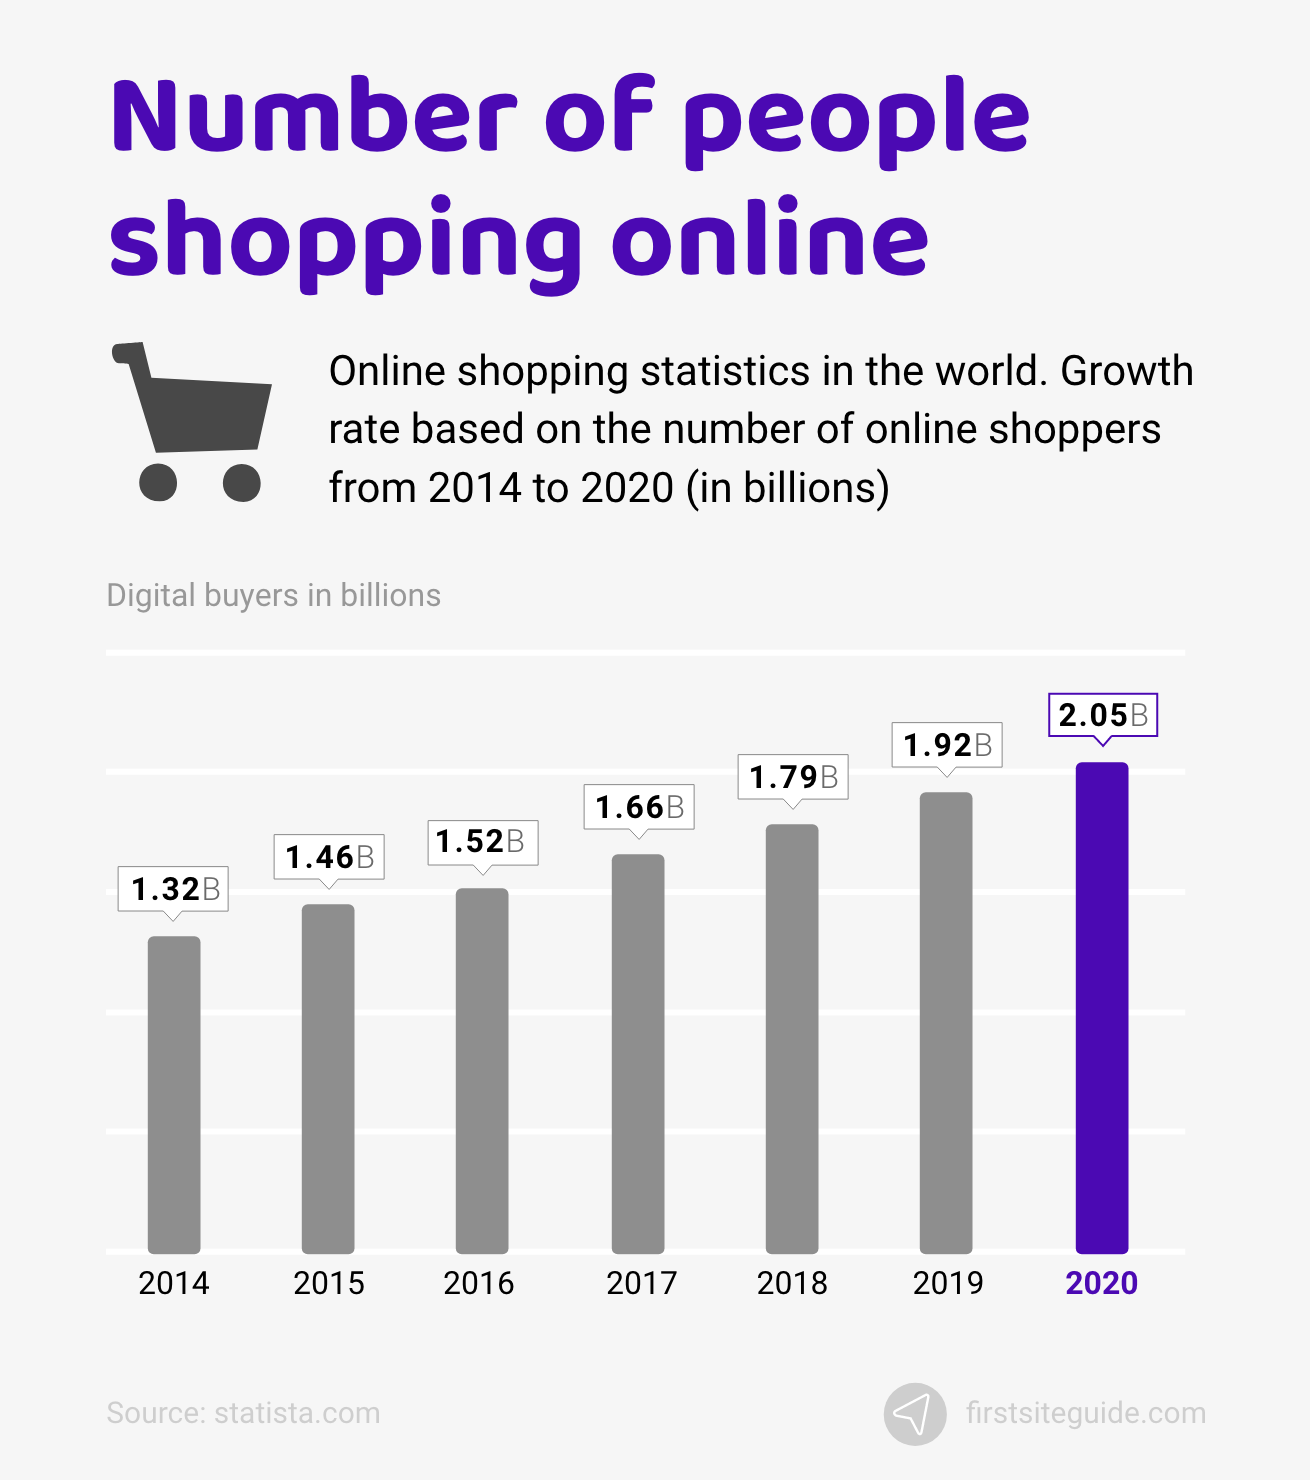
59. How many people shop online?
A lot of people prefer shopping online as opposed to shopping at brick-and-mortar locations. To be more specific, up to 2.05 billion internet users are expected to buy something online in 2020. That accounts for over 26% of the global population, making eCommerce extremely popular.
(Source: Statista)
60. 3.91 trillion dollars in estimated sales of products and services via the internet.
Another thing that’s expected in 2020 is over $3.914 trillion in eCommerce sales, measuring a 16.5% growth rate over the previous year.
(Source: eMarketer)
61. Due to the COVID-19 pandemic, eCommerce sales are expected to grow by 18.4%.
Studies show that the pandemic has positively affected the global eCommerce market, with eCommerce sales expected to grow up to 18.4%. China and India are likely to decelerate in 2020 when compared to previous years. With the number of internet users in the world rising due to the pandemic, eCommerce sales follow.
(Source: eMarketer)
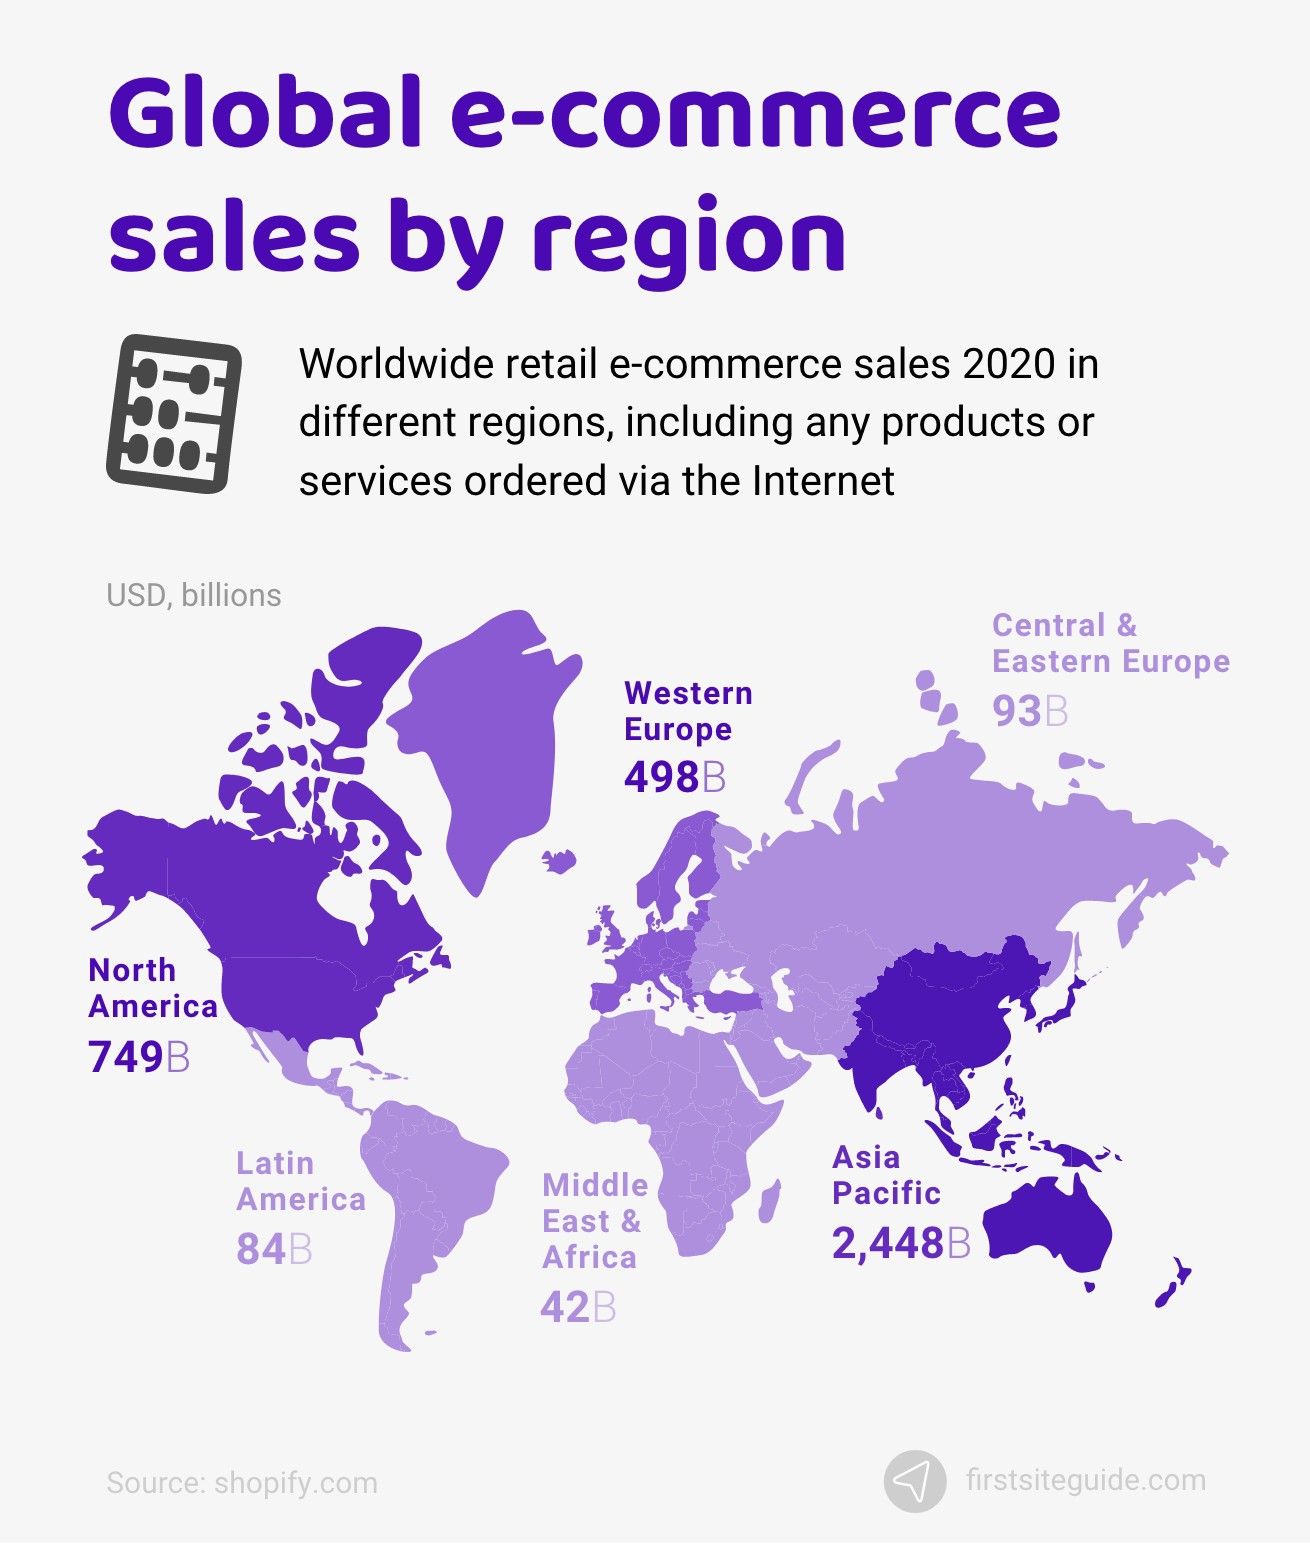
62. eCommerce statistics by country and region.
The most popular countries in the eCommerce landscape in 2020 are the Philippines, Malaysia, and Spain, with a 20% estimated growth. Region-wise, Asia-Pacific and North America lead retail and account for over 64% of the global market according to internet traffic statistics.
(Source: Shopify)
63. Net sales of Amazon in 2019 hit $280.5 billion.
Amazon is the world’s most popular eCommerce website and has made over $280.5 billion in net sales in 2019 alone. Most of the revenue generated by Amazon is through eCommerce sales, third-party seller revenue, and subscription services such as Amazon Prime.
(Source: Statista)
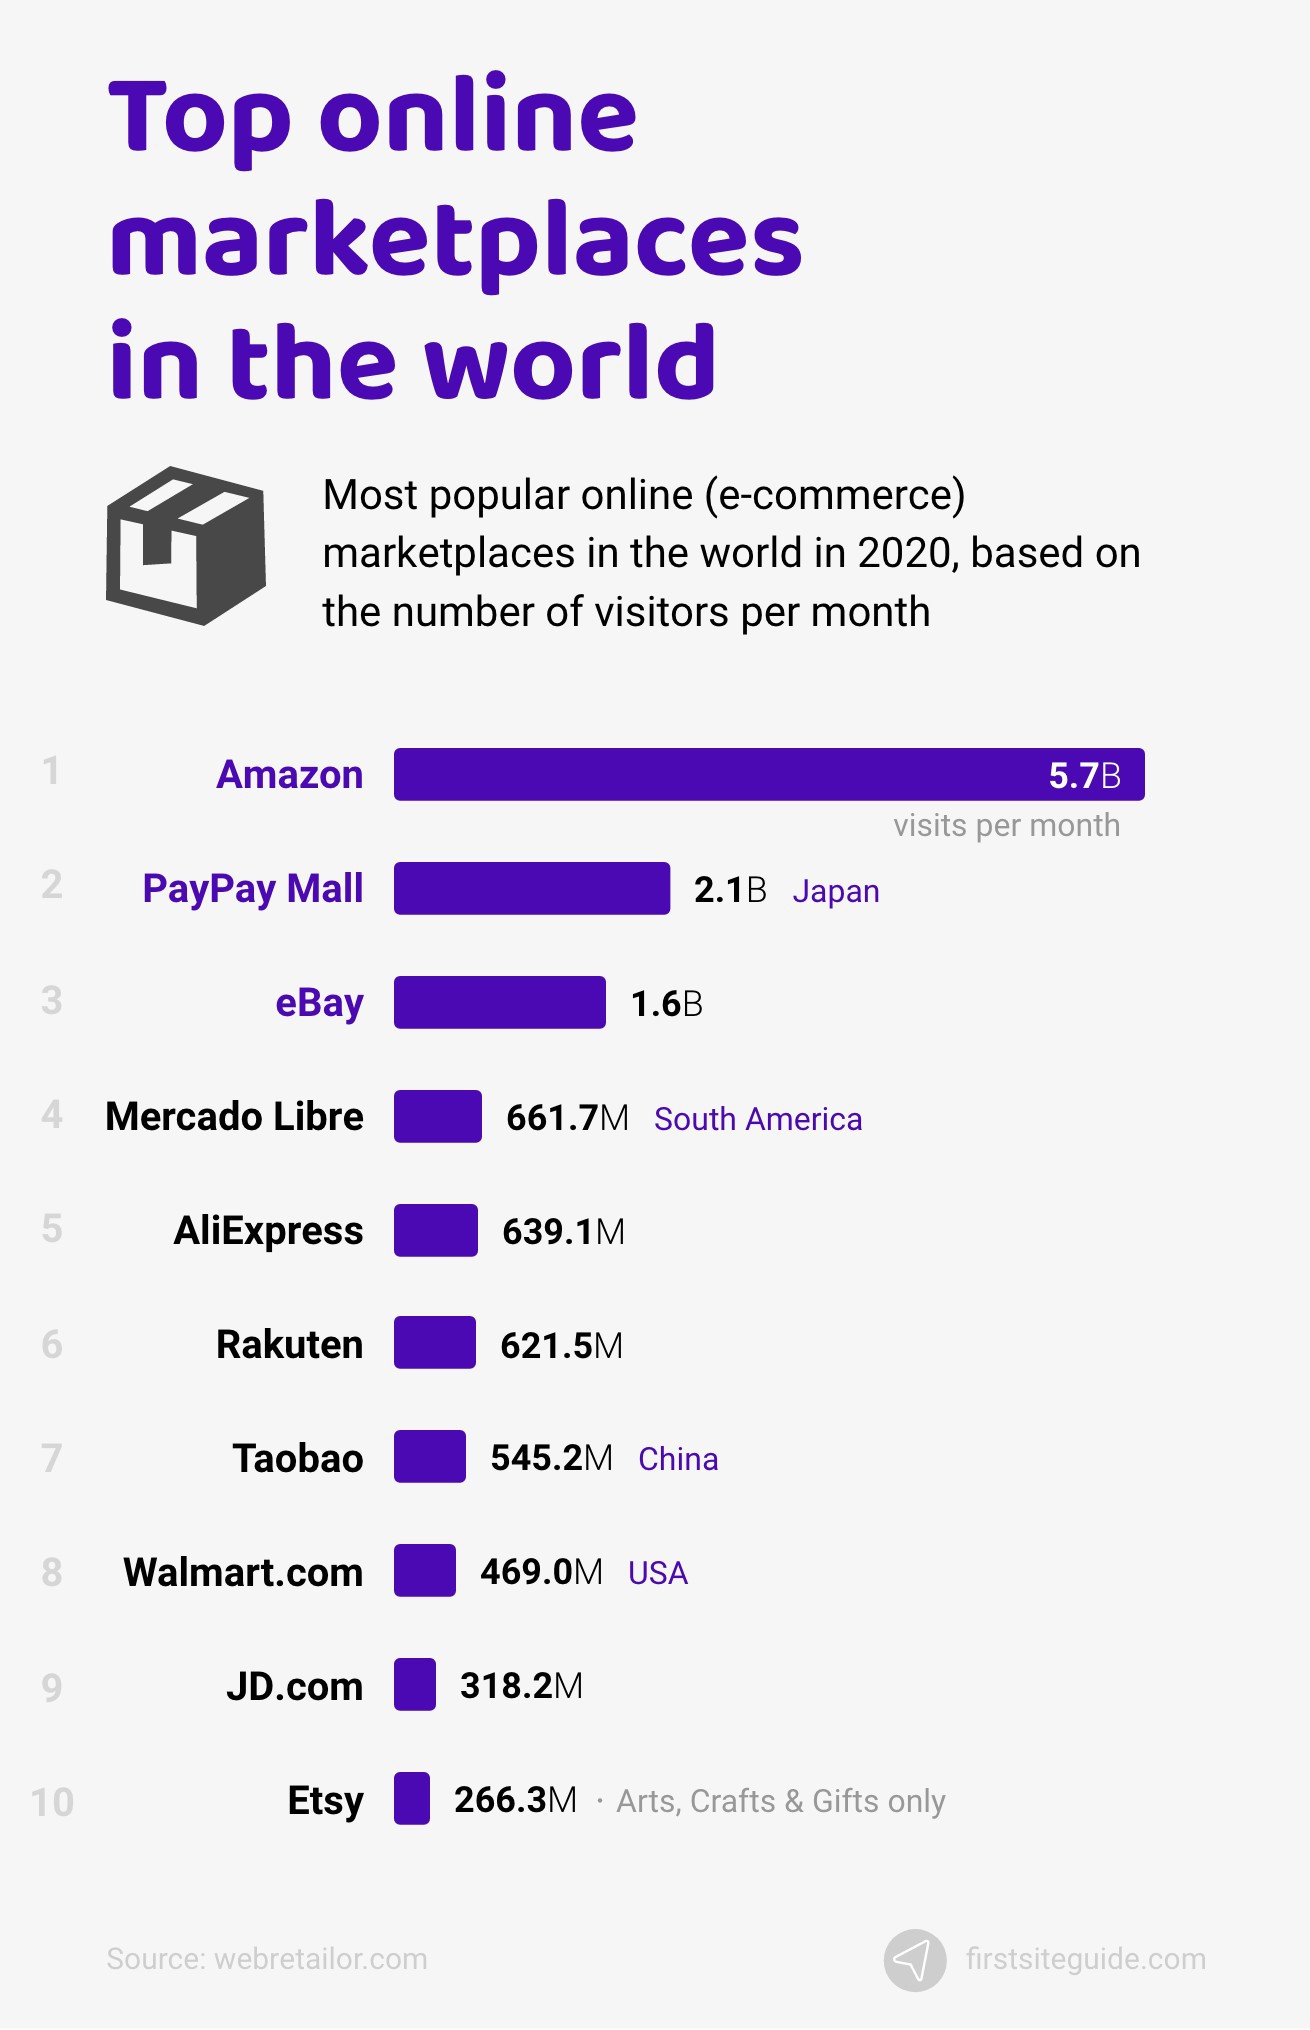
64. Top eCommerce marketplaces in the world.
eCommerce marketplaces have already taken the popularity crown from brick-and-mortar locations. Amazon is the leading general eCommerce market with a whopping 5.7 billion visits per month. The second place goes to the Japanese general eCommerce store PayPay Mall, which boasts 2.1 billion visits monthly visits. The third on the list is eBay with about 1.7 billion visits per month.
(Source: Webretailor)
65. Cyber Monday in 2019 hit record sales of $9.4 billion.
Cyber Monday is the first Monday after Thanksgiving – and is equally as important in retail as Black Friday. On Cyber Monday, numerous eCommerce stores have a wide selection of items, most notably electronics that internet users worldwide can purchase at a discounted price. The Cyber Monday sale event in 2019 hit a record number of $9.4 billion in sales, a 19% increase over the previous year.
(Source: Forbes)
66. 82% of evergreen shoppers used a search engine related to their shopping.
Studies show that about 82% of evergreen shoppers have used a search engine for their shopping needs. This is an increase compared to last year. At least 2/3 of those shoppers have been inspired by online videos – and nearly 2/3 of all deal-seekers were shopping for themselves during the holiday due to the many holiday discounts.
(Source: GoogleThink)
67. 82% of online shoppers in the Americas use credit or debit cards.
Most internet users and online shoppers in the Americas use cards for their purchases, specifically credit or debit. Over 82% of all internet shopping is done either through credit or debit cards. This is closely followed by payment platforms such as ApplePay, PayPal, AliPay, and others at 66% usage.
(Source: Statista)
68. 63% of online shoppers abandon their carts in the US due to high shipping costs.
No matter how many people are on the internet right now, none of them like shipping. People are more likely to purchase a more expensive product if the shipping is free than a less expensive product with shipping that makes up for the price gap. Over 63% of online shoppers decide not to purchase an item in the US due to the high shipping costs.
(Source: Statista)
69. WooCommerce is the most popular eCommerce software platform (14.4%).
There are many platforms for eCommerce websites, the most popular of which is WooCommerce. Over 14.4% of all eCommerce websites use WooCommerce. The silver medal goes to Shopify, with about 10.26% of the global market, and the bronze medal goes to Wix Stores at 7.2% according to internet use statistics.
(Source: Statista)
Online Advertisement Stats
Advertisement and marketing as a whole make the retail world go round. The world of advertisement is one of the most exciting industries out there. However, with the introduction of the internet, the world of advertisement has undergone massive changes. With the number of smartphones in the world on the rise, mobile advertising is becoming a big thing as well.
Digital advertisements are almost as popular as traditional advertisements and are slowly gaining popularity annually. The world of digital advertising is not only lucrative, it’s more extensive than you can imagine.
Below, we’ll go over some of the most interesting internet statistics in the world of online advertisement.
70. The Online Advertising Market was valued at $304.0 billion USD in 2019 and is expected to reach $982.82 billion USD by 2025.
The world of digital advertising is one of the most prolific digital endeavors on the internet landscape and accounts for some of the most interesting facts about the internet. Today, digital advertising’s estimated value exceeds $304.0 billion USD, and it’s expected to reach up to $982.82 billion USD by 2025, a compound annual growth rate of 21.6% over five years.
(Source: MordorIntelligence)
71. Top 3 major platforms in the digital advertising world.
Digital advertising is a big deal and reaches across a wide array of platforms. The most popular platforms that digital advertising uses are Google, Facebook, and Twitter. Other social media platforms are also a popular hub for digital advertisements. With the number of internet users that use social media on the rise, social media is a popular digital advertising platform.
(Source: MordorIntelligence)
72. More than half of digital ad investments are captured by Google and Facebook.
Digital advertisement is a worthwhile endeavor as long as it’s advertised on popular platforms. The two most popular digital ad investments are Google and Facebook, which account for over 56% of the global advertisement space. Considering how many websites are on the internet, Google and Facebook own a vastly disproportionate amount of the global advertisement space.
(Source: eMarketer)
73. Around 45% of ad spending comes to search advertising.
Ads aren’t only widespread, they’re pretty expensive when considered in an overall perspective. Most advertisement spending goes into search advertisements, with over $1.58 billion spent in 2020 alone.
(Source: Statista)
74. 55% of digital advertisement money will be spent on mobile ads.
With the number of smartphones in the world on a steady rise and mobile internet access becoming the dominant platform, more and more money is being invested into mobile advertisement. Mobile advertisement currently claims 55% of all digital advertisement funds.
(Source: Statista)
75. Digital advertising is slowly overtaking the advertisement market.
The spending placed on digital advertisement is expected to overtake the spending on traditional advertisement by the end of 2020. The final spending on digital advertising is expected to reach $530 billion by the end of 2020, giving it more than half the spending on overall advertisement.
(Source: FinancialTimes)
76. 47% of internet users globally use an ad-blocker today.
Advertisements, while a lucrative business, can get quite annoying. That’s precisely why over 47% of internet users opt for ad-blocking software to block advertisements. With a large number of websites hosting some kind of advertisement, users prefer to enjoy their content advertisement-free.
(Source: Globalwebindex)
Internet (Cyber) Security Stats
Cybersecurity is one of the most important things on the internet as a whole. Considering how many countries have internet access today, it naturally leads to more and more internet businesses opening.
The internet, while a vast and amazing place, can be quite dangerous at times. This is because some parts of the internet are crawling with hackers, scammers, and malicious individuals, as confirmed by internet usage statistics.
With cybercrime comes cybersecurity, and with both of these comes our list of nine interesting facts and statistics about the world of internet security.
77. Hackers attack every 39 seconds.
Hackers, scammers, and other malicious individuals around the web attack persons, websites, and businesses every 39 seconds, which is one of the most worrying facts about the internet and its overall security. The main factors that allow hackers to hack are weak passwords and computer protection.
(Source: Eng.Umd.edu)
78. 30,000 websites are hacked every day.
Over 30,000 websites are hacked each day. These hack attacks result in stolen information, ruined websites, and leaks. Considering how many people use the internet, these statistics are likely to worsen over time.
(Source: Sophos Labs)
79. WordPress represents 94% of all CMS platforms vulnerable to hacking.
WordPress is by far the most popular platform for website creation globally, but it’s sadly the most susceptible to hackers. WordPress accounts for over 94% of all content management platforms vulnerable to hacker attacks.
(Source: Sucuri)
80. Cybercrime cost $3.5 billion for US businesses in 2019 (FBI’s annual Internet Crime Report).
Cybercrime is one of the most costly things that can happen in the digital landscape. It wound up costing US businesses over $3.5 billion in 2019 alone, which is an increase compared to previous years.
(Source: CBR Online)
81. Over 9 billion data points related to companies and organizations were revealed in a huge hack in April 2018.
The biggest data breach in the history of the internet was in 2018 when a security breach happened to Apollo’s sales intelligence company. That resulted in over 9 billion data points related to companies and organizations getting leaked. Luckily, no everyday internet users were harmed or had their data stolen.
(Source: Statista)
82. A 300% increase in cyber crimes during the COVID-19 pandemic.
Cybercrime is experiencing a colossal rise during the coronavirus epidemic. Cybercrimes are three times more likely to occur during the pandemic than before. There are countless ways to use the internet, and the coronavirus epidemic has really brought that to light in a negative way.
(Source: TheHill)
83. Small businesses are the target of 43% of cyber attacks.
Small businesses lack the essential protection software that helps big companies ward off hackers, making them susceptible and vulnerable to cyber-attacks.
(Source: Verizon)
84. $200,000 is the average cost of cyber attacks for companies.
Cyber attacks can be quite costly, costing businesses an average of $200,000 per cyber attack. This is especially troublesome when small businesses’ vulnerability to hacking is considered. While small businesses comprise a small portion of the internet world, they’re disproportionately targeted by hackers.
(Source: CNBC)
85. 60% of small and midsize businesses fold within six months of a cyber attack.
As stated above, small businesses have a much harder time dealing with cyber attacks and hackers, and that’s precisely why over 60% go out of business within six months of a cyber attack.
(Source: Inc)
Internet of Things (IoT) Stats
IoT stands for the Internet of Things: a network of devices connected to the internet that can transfer data over the internet without any human input or interaction. IoT devices are all smart devices connected to the internet, such as:
- Smart speakers
- Smartphones
- Fitness trackers
- Smart fridges
- Medical sensors
There are many IoT devices all across the world, and there are even more interesting IoT facts and statistics about them. Because we know how many people have internet access in their homes, we can also predict that IoT is going to rise in popularity.
86. By 2030, the estimated number of IoT devices will jump to 125 billion.
There are many smart devices around the globe, but the number of IoT devices is expected to grow to 125 billion by 2030. This is a 403% increase over today’s 31 million IoT devices, according to internet traffic statistics.
(Source: IHS Markit)
87. 1.1 trillion dollars is the projected global spending on IoT in 2023.
IoT is a buzzing new technology that promises to revolutionize fields such as transport, marketing, hospitality, and many more. As of 2019, there are over 620 IoT platforms – and that number is projected to skyrocket in the future. IoT devices are a prospering and promising investment, and that’s why experts predict that by 2023, global spending on IoT will exceed 1.1 trillion dollars.
(Source: Statista)
88. The smart home (IoT) market is projected to grow to $53.45 billion by 2022.
Smart homes are an essential part of IoT and are expected to grow to $53.45 billion in revenue in the next two years. They’re also one of the most interesting ways to use the internet as users optimize their daily at-home dealings.
(Source: Statista)
89. An estimated 127 new devices connect to the internet every second.
New IoT devices are being activated every day. An estimate dictates that about 127 brand new devices connect to the internet every second. That’s 7620 new devices per hour, 182880 per day, and over 66.93 million new devices in 2020 alone.
(Source: Mckinsey)
90. 26 smart objects will be around every human on earth.
Smart objects, such as smart appliances and home improvement objects, are popular, but estimates show that a staggering average of 26 smart objects will surround every human on earth in the next few years – a very interesting internet statistic.
(Source: Intel)
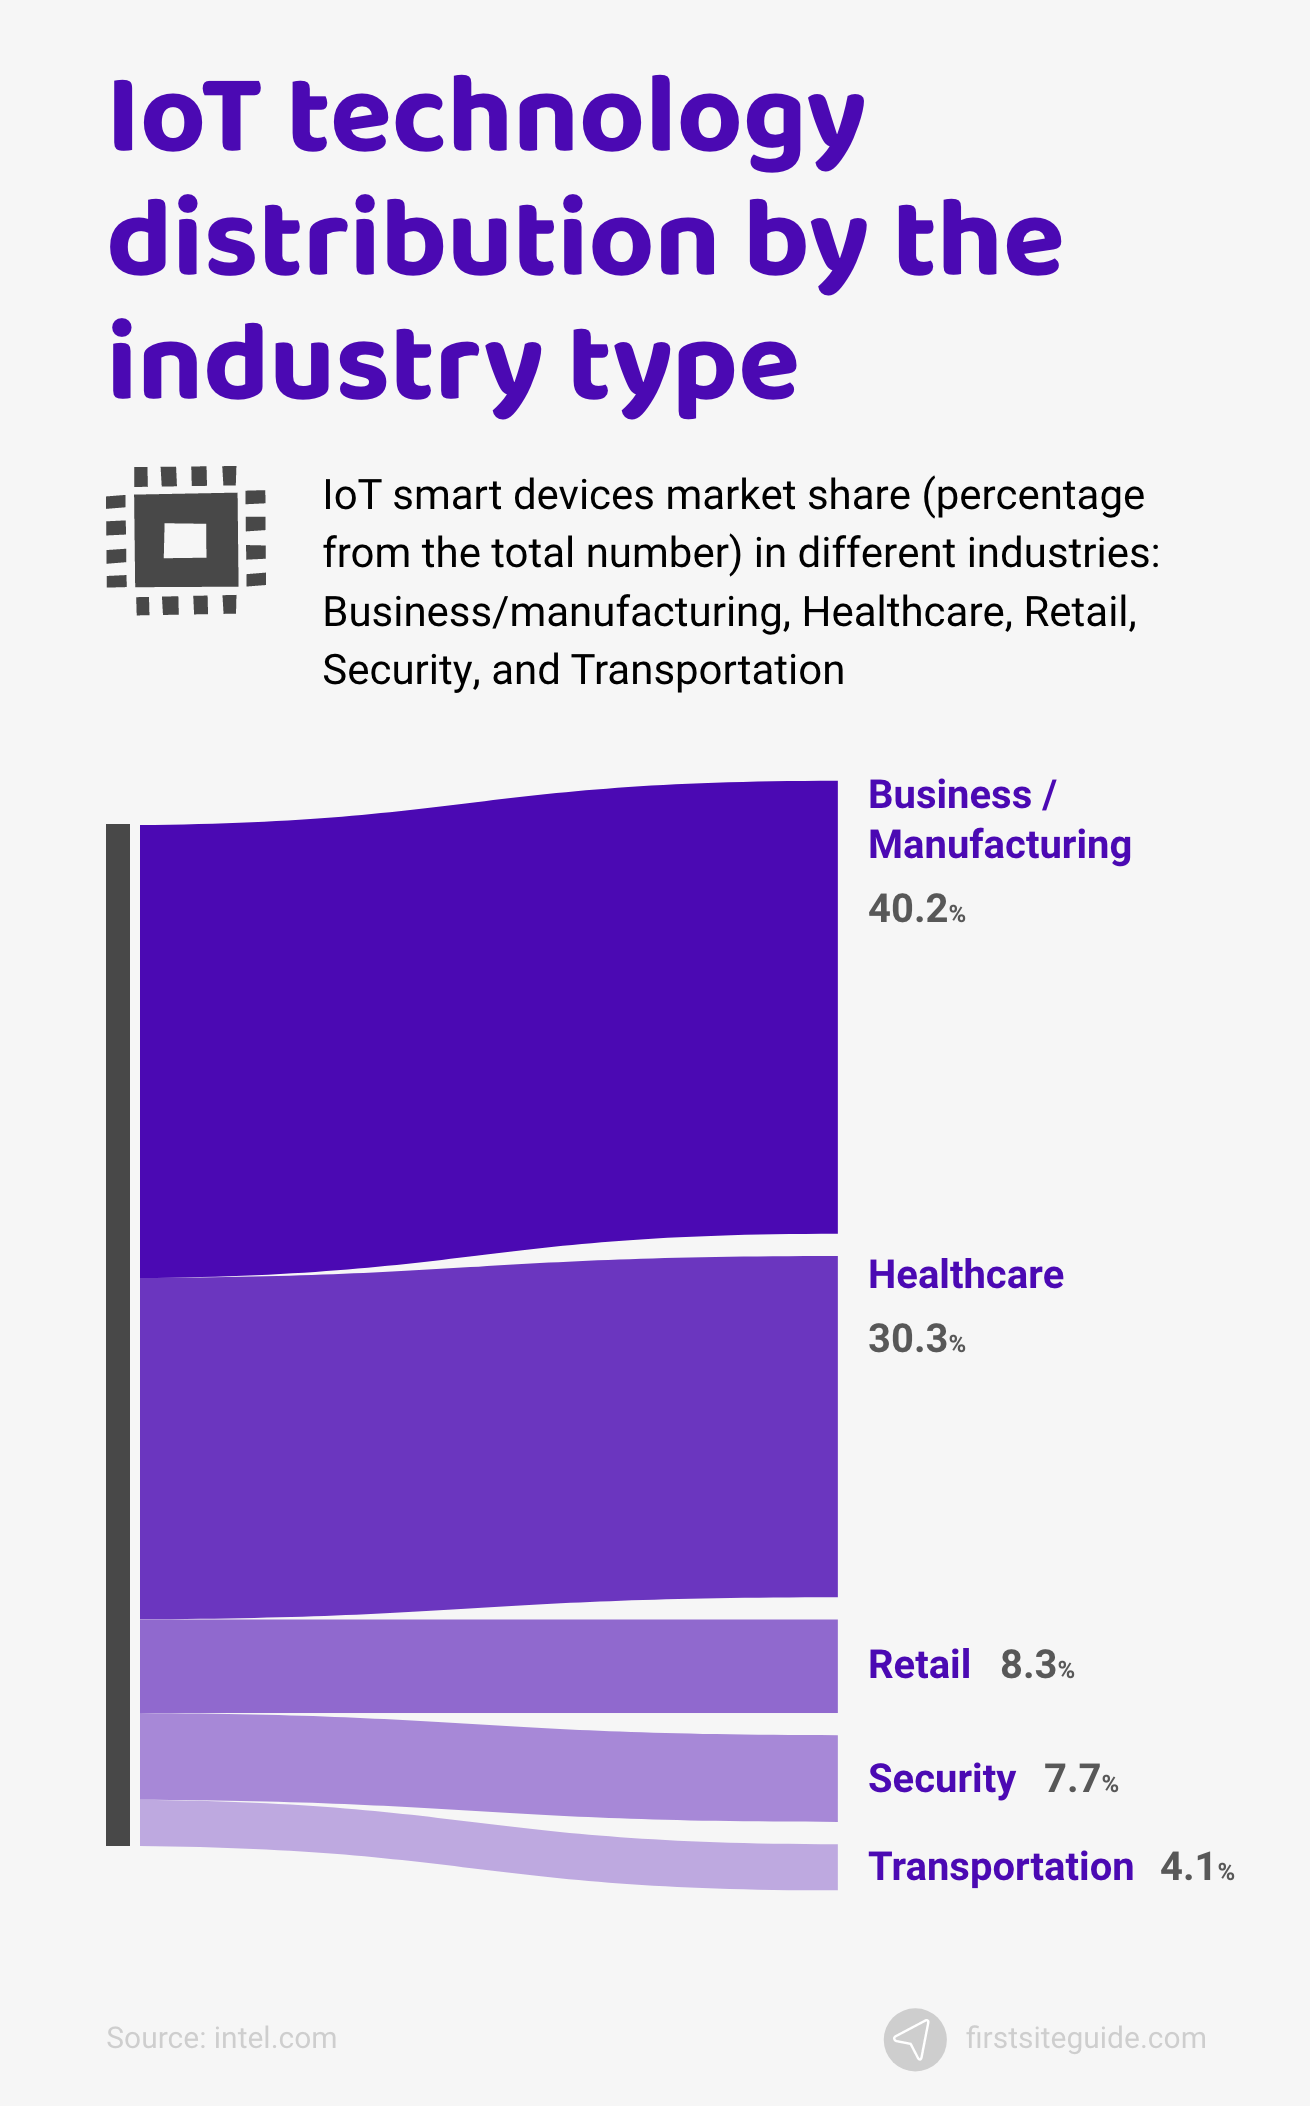
91. The two biggest IoT technology markets will be healthcare and manufacturing.
IoT shows immense promise in the technology sector, with experts projecting that the two industries that will benefit the most from these devices are healthcare at 30.3% and manufacturing at 40.2% of the market, according to internet traffic statistics.
(Source: Intel)
92. Distribution of the total global IoT technologies by the industry type.
IoT isn’t only going to benefit business, manufacturing, and health care. Retail accounts for 8.3% of the potential market share, while security accounts for 7.7%. Lastly, transportation will benefit from this technology, holding 4.1% of the market share.
(Source: Intel)
Other Notable Internet Stats and Facts
Aside from all of the important facts about specific internet topics, the internet has many more fun facts and statistics on a broader range of subjects.
The internet is a free, wild, and ever-expanding place, making it chock full of surprises, interesting places, and fun facts. Getting to know the internet around the world is an extensive journey, but ultimately one that pays off.
There is much more to the internet than just hosting, security, and advertisement. In this section, we’ll discuss some of the more interesting fun facts about the internet.
93. The internet was created in 1983.
ARPANET, the modern internet’s predecessor, adapted the TCP/IP system on January 1st, 1983, thus creating the modern-day internet. If you’re wondering how many people in the world had the internet at that time, the number was quite small.
(Source: History)
94. It was 1971 when Ray Tomlinson invented and developed electronic mail.
Electronic mail, better known as email, was developed in 1971 by Ray Tomlinson, who invented a new way to use the internet. Electronic mail predates the internet, with the first email like software being developed even earlier in 1965. While primitive, this 1965 piece of software allowed users to leave messages on the computer for people to read once they powered up the machine again.
(Source: Phrasee.co)
95. A staggering 306.4 billion emails are sent daily in 2020.
Emails are being sent every second of every day, and most of the emails sent out are spam. The amount of emails sent daily in 2020 is 306.4 billion, and that number is expected to reach 347.3 billion in 2023. That means that, in 2020 alone, over 112.14 trillion emails will be sent, with over 75 trillion emails being identified as spam, according to internet traffic statistics.
(Source: Statista)
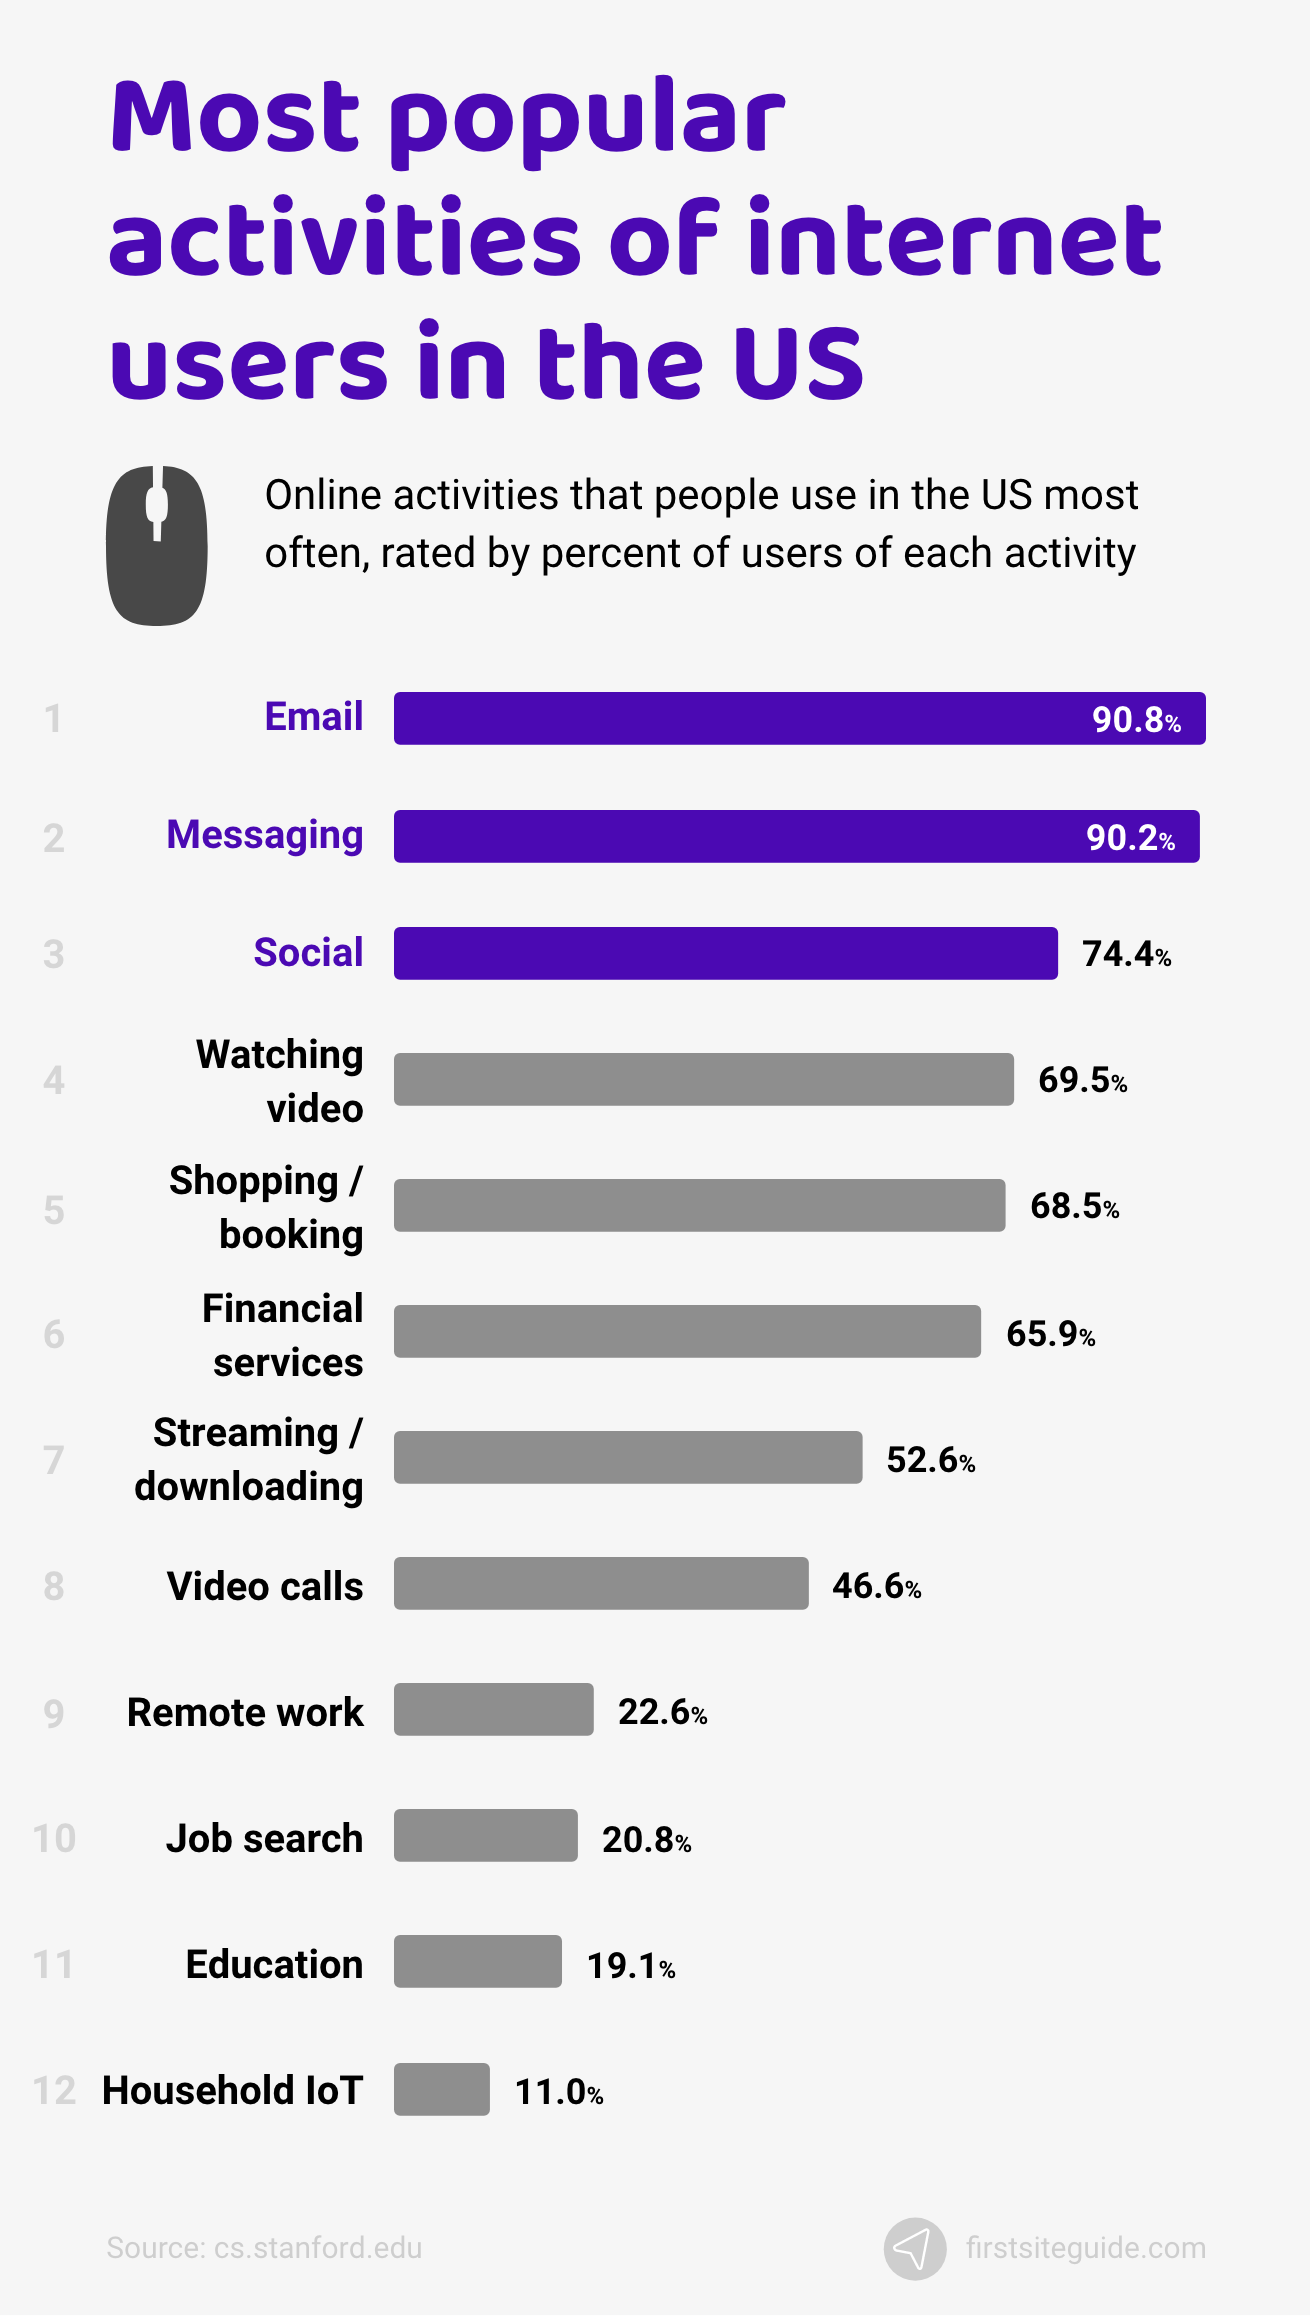
96. For over 90% of internet users, the most popular activity on the internet is using email.
The most popular activity on the internet is using email. Over 90% of internet users have and use their email accounts. Even activities like surfing and searching for general information are not as popular as using email.
(Source: Cs.Stanford.edu)
97. Jean Armour Polly coined the term “Surfing the internet” in 1992.
While we mostly browse the internet in 2020, “surfing the internet” was what users mainly did in the first two decades since the first website. The term was popularized in 1992 by Jean Armour Polly, a New York librarian, and is used today by most internet users.
(Source: Buzzfeed)
98. The first widely used web browser, Mosaic, was released in 1993.
Web browsers are the lifeblood of the internet. They index and catalog all of the pages we want, and we couldn’t imagine what the internet would be like without Google Chrome. The first widely used commercial web browser was Mosaic, and it was released to the public in 1993.
(Source: LivingInternet)
99. Google officially launched in September 1998.
Google, the world’s most popular web browser and search engine, was launched in 1998 and became the dominant search engine in 2002. Today, more than one billion internet users worldwide visit and use Google on a daily basis.
(Source: Wikipedia)
100. In 1997, WiFi was invented and released to the public.
WiFi connection offered a replacement to phone line dial-up internet in 1997, but it only became widespread in the early 2000s. Dial-up internet is still used in some rural or remote areas.
(Source: Purple.ai)
101. The first music streaming website started in 1993.
The first music streaming website was the Internet Underground Music Archive, and it was released to the public in 1993. It provided a place for independent artists to share their music, as the internet around the world was still a pretty small place with no designated space for aspiring musicians.
(Source: Wikipedia)
102. In 2004, podcasting was invented.
Podcasts, as we know them today, started back in 2004. The first-ever podcast was called The Backstage Pass and was hosted by Adam Curry and Dave Winer.
(Source: Internationalpodcastday)
103. Today, there are more than 1.5 million unique individual podcasts.
The number of podcasts has skyrocketed in recent years, with over 1.5 million unique podcasts available in 2020. 2020 is also the most popular year for podcasts yet, with the number of new podcasts rising now more than ever.
(Source: Listen Notes)
104. The rise of online video; in 2005, YouTube was born!
YouTube is one of the web’s favorite websites and is, without a doubt, the most popular video-sharing website around. It was created back in 2005 by Jawed Karim, Steve Chen, and Chad Hurley. The first video on YouTube was titled “Me at the zoo” and was posted by Jawed Karim. A number of websites have tried to dethrone YouTube as the world’s most popular video-sharing platform, but none have come close to its success.
(Source: FMGsuite)
105. As of 2020, more than 500 hours of video are uploaded to YouTube every minute.
YouTube is a gargantuan hub of videos, and in 2020, over 500 hours of video are uploaded to YouTube every minute. To put this into perspective, that’s 30,000 hours of video posted each hour, 720,000 hours of video posted each day, and 263.52 million hours of video posted in 2020.
(Source: Statista)
106. 15% of regular internet users work more at home.
The internet has enabled many people to work from home. Internet world stats show that 15% of internet users spend at least 1 hour a week online, reporting that they work more at home, even though their time spent in the office stays the same.
(Source: Cs.Stanford.edu)
107. Internet surfers spend little time on TV and in newspapers.
To no one’s surprise, those who spend more of their time on the internet spend much less time consuming other media types. Internet users spend significantly less time watching TV and reading newspapers.
(Source: Cs.Stanford.edu)
108. Kiss.com became the first modern online dating website in 1994.
Online dating is one of the most popular ways to use the internet in the digital age, and it all started with the world’s first dating website, Kiss.com, which was launched back in 1994.
(Source: Pov.org)
Conclusion
To say that the internet world is massive would be an understatement. These internet statistics are just a part of a much larger world. There are so many interesting numbers, statistics, and facts about the internet that attempts to list all of them in one single article would be impossible.
That’s precisely why we’ve listed our favorite 108 internet statistics that you can use to gain a better perspective on the digital landscape.
Hopefully, we’ve answered some important questions for you about the internet as a whole with these statistics.
5 comments on “Internet Statistics 2024: Facts You Need-to-Know”
Leave a Reply

Thank You for sharing the detailed insights of the internet stats.
Keep providing such useful information.
Thanks Riya!
Thanks a lot for this informative article. It’s really helpful. Many new things I have learned from the content. Thanks again.
Thanks Raymond!
That’s very good content. Thanks a lot.